State
In the previous step, we added an on_click event handler to our Map to fetch relevant data. But we didn't do anything to update our App's state to reflect this data.
In this step, we leverage the concept of state via the use_state hook to configure our chart to update after new data has been fetched following a user's click of the map.
What is State?
State refers to the management of the "state" of your page at any given moment, or in other words, both what is being rendered on your page (the components), and how it is being rendered (the properties of the components).
When developing your page, the content tree that you configure as the return object of your page function (i.e. the root component and its nested content) should explicitly include everything that could possibly be rendered at any given time, depending on what users interact with.
Whether or not each item actually gets returned or not, or with what properties it gets returned, should be dictated by use of state variables.
These state variables are primarily defined via the use_state hook that is made available from the lib.hooks module.
How does use_state work?
The use_state hook is a function that lets you add state to your component. It returns a pair: the current value of the state variable, and a function to update it. When you call the update function, the component will re-render with the new state.
For example:
value, set_value = lib.hooks.use_state(initial_value)
valueis the current state, which will be set toinitial_valueon the very first renderset_valueis a function you call to update the state.
Applying State to Our App
We'll create and initialize a state variable and setter for the chart data using use_state.
When the user clicks on the map, we'll fetch the data and update the state using the setter, which will automatically re-render the page with the new data.
Tip
Consider trying this yourself before checking how we did it below.
Here's how that should look:
@App.page
def home(lib):
    chart_data, set_chart_data = lib.hooks.use_state(None)  # <--- New line

    def handle_map_click(e):
        print(f"Getting data for coordinate {e.coordinate}")
        lon, lat = lib.utils.transform_coordinate(e.coordinate, "EPSG:3857", "EPSG:4326")
        data1 = lib.utils.fetch_json(f"https://geoglows.ecmwf.int/api/v2/getriverid?lat={lat}&lon={lon}")
        print(data1)
        print(f"Getting hydroviewer data for {data1.river_id}")
        data2 = lib.utils.fetch_json(f"https://geoglows.ecmwf.int/api/v2/hydroviewer/{data1.river_id}")
        print(data2)
        set_chart_data([{"x": x, "y": y} for x, y in zip(data2.datetime_forecast, data2.flow_median)])  # <--- New line

    return lib.tethys.Display(
        lib.tethys.Map(on_click=handle_map_click)(
            lib.ol.layer.Image(
                options=lib.Props(
                    title="GEOGLOWS Streamflow Service"
                )
            )(
                lib.ol.source.ImageArcGISRest(
                    url="https://livefeeds3.arcgis.com/arcgis/rest/services/GEOGLOWS/GlobalWaterModel_Medium/MapServer"
                )
            ),
        ),
        lib.tethys.Panel(
            lib.tethys.Chart(data=chart_data)  # <--- New property
        )
    )
Code Analysis
chart_data, set_chart_data = lib.hooks.use_state(None)
We need a variable to store our chart data, and it needs to be a state variable since it is a dynamic variable tied to either the what or how of our rendered content tree. In the case of the chart data, we will initialize this state variable to None, since there's no data until a user clicks the map.
set_chart_data({...})
We can now use our chart_data updater function to update the value. We want to format this data in the way that the Chart component will be expecting it, which is a list of dict objects, where each object has both "x" and "y" keys representing the x/y values of the point to be plotted.
lib.tethys.Chart(data=chart_data)
Now we can pass the chart_data state variable to the Chart component using the data keyword arg. This will work fine because data=None is actually the default if not supplied at all.
View the Results
Save your changes, return to the browser, and refresh.
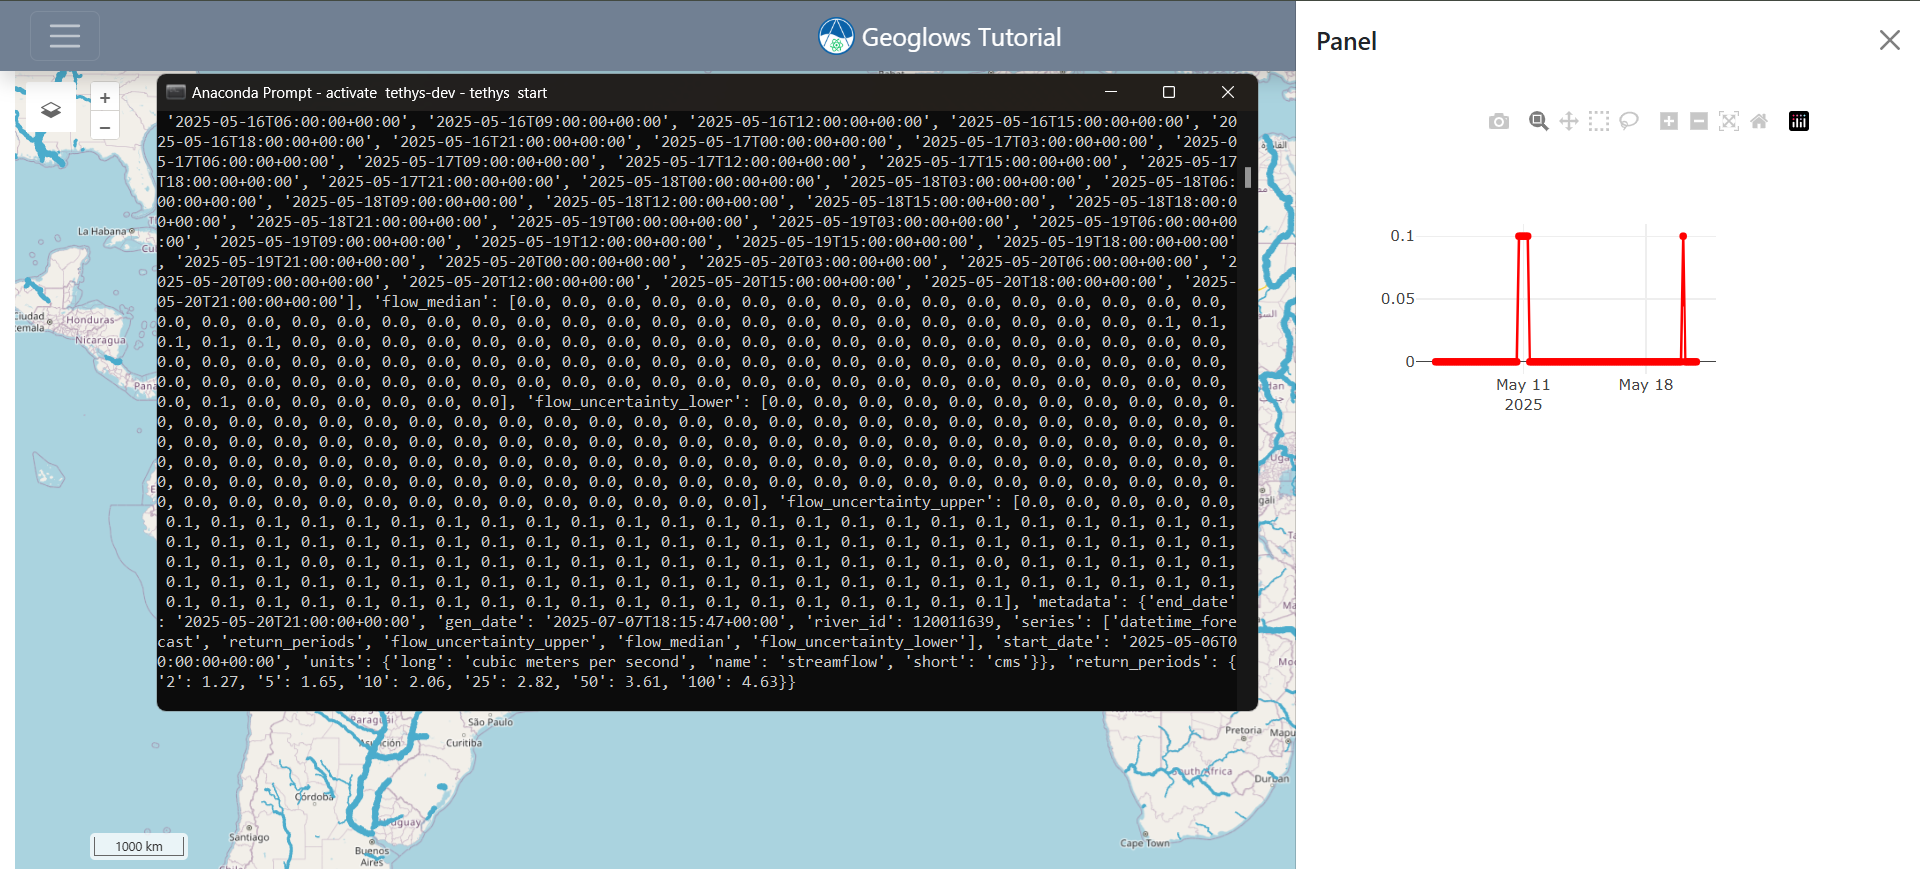
Just like before, click anywhere on the map. We left the print statements in because you'll quickly notice that nothing changes immediately. Thus, you may want to verify it's still working via the command-line terminal.
However, once the two queries have successfully returned, you should now see data actually render in the chart!
It should look something like this (though your data will most likely be different):
We use
use_stateto create achart_datastate variable and its setter.When the map is clicked, we fetch new data and update
chart_data.The chart component receives the latest data from state and updates automatically.
This pattern of using state to manage dynamic data is fundamental to building interactive Component Apps.