Event Handlers
Now we are ready to add custom interactivity to our application. Remember that we want to allow a user to click on a feature on the map to pull open a chart that renders data associated with the clicked feature. In this step we will configure the map with an event handler.
What is an Event Handler?
Event handlers allow your app to fire off code based on some form of update or interaction. Most components can be configured with event handlers, and doing so is generally as simple as passing a function to the component using the appropriate keyword argument. When the update or interaction occurs to the associated comopnent, the provided function will be called.
Note
Most event handler keyword arguments begin with on followed by a verb, such as on_click or on_change.
Tip
See ReactPy's Event Handler documentation for more info.
Adding an Event Handler to our App
First, we need to create a function that will fetch the data for our chart:
def handle_map_click(e):
    lon, lat = lib.utils.transform_coordinate(e.coordinate, "EPSG:3857", "EPSG:4326")
    data1 = lib.utils.fetch_json(f"https://geoglows.ecmwf.int/api/v2/getriverid?lat={lat}&lon={lon}")
    data2 = lib.utils.fetch_json(f"https://geoglows.ecmwf.int/api/v2/hydroviewer/{data1.river_id}")
We must nest this function within our home page function and can then pass it to the Map component's on_click keyword argument.
Your home page function should now look like this:
@App.page
def home(lib):
    # New function inserted here
    def handle_map_click(e):
        print(f"Getting data for coordinate {e.coordinate}")
        lon, lat = lib.utils.transform_coordinate(e.coordinate, "EPSG:3857", "EPSG:4326")
        data1 = lib.utils.fetch_json(f"https://geoglows.ecmwf.int/api/v2/getriverid?lat={lat}&lon={lon}")
        print(data1)
        print(f"Getting hydroviewer data for {data1.river_id}")
        data2 = lib.utils.fetch_json(f"https://geoglows.ecmwf.int/api/v2/hydroviewer/{data1.river_id}")
        print(data2)

    return lib.tethys.Display(
        lib.tethys.Map(on_click=handle_map_click)(  # <---- New on_click property added here
            lib.ol.layer.Image(
                options=lib.Props(
                    title="GEOGLOWS Streamflow Service"
                )
            )(
                lib.ol.source.ImageArcGISRest(
                    url="https://livefeeds3.arcgis.com/arcgis/rest/services/GEOGLOWS/GlobalWaterModel_Medium/MapServer"
                )
            ),
        ),
        lib.tethys.Panel(
            lib.tethys.Chart()
        )
    )
Code Analysis
def handle_map_click(e):
The event handler function. At runtime, the e argument will contain metadata about the event that triggered the function's execution.
Every standard event handler behaves this way.
For a map click, we can access the specific coordinate of the click with e.coordinate.
lib.utils.transform_coordinate
A helper function used to transform a coordinate from one projection to another.
The getriverid API requires lat and lon query parameters, so we'll need to convert to "EPSG:4326".
lib.utils.fetch_json
A helper function used to fetch JSON data from a URL and return it as a special Python dictionary-like object that allows accessing the values associated with keys via dot notation in addition to the standard bracket notation (e.g. data.key or data["key"]).
The getriverid API returns JSON, with the river feature most closely associated with the point of the user's click stored as river_id. We can pass this value into our subsequent call to the hydroviewer API to get the associated streamflow data.
print statements
We added these as our temporary feedback loop to ensure that our event handler is working. These will be removed once we have configured the data to be rendered in the Chart.
View the Results
Save your changes, return to the browser, and refresh.
Now click anywhere on the map.
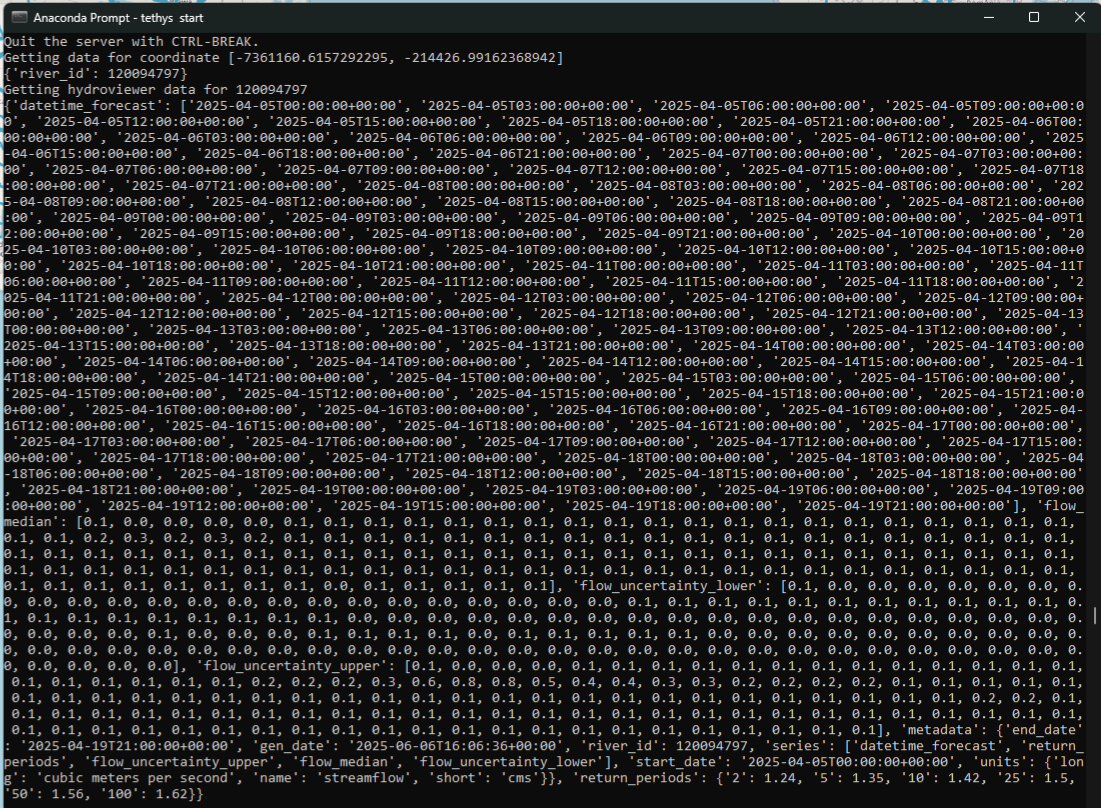
Though nothing in the web page will appear to have changed, pull up your command-line terminal where your server is running (i.e. where you executed tethys start).
You should gradually see all of the print statements showing up.
These print statements should look similar to the following:
Key Takeaways
Event handlers let you respond to user actions, such as clicking on the map.
You add an event handler by passing a function (e.g., handle_map_click) to the component's event keyword argument (e.g., on_click).
The event object (e) provides information about the interaction, such as the clicked coordinate.
At this stage, the chart is not yet updated; the event handler only fetches and prints data.