User Experience (UX)
Though our app now technically achieves the goal we set out to achieve - that of allowing a user to click on a map and view relevant data on a chart - your experience as user in the previous step was likely not very positive.
Current UX Issues
Here are just a few examples of poor UX in our current app:
The app loads with the panel already open, overlaying almost half the map.
The panel's title is "Panel", which could be more specific to our use case.
The empty chart is not even recognizable as a chart - and even if so, it's empty anyway.
When we click on the map, we get no feedback that anything is happening until at least 10 seconds later when the chart data suddenly renders.
The list could go on...
A positive user experience is essential for the success of any application. When users find your app intuitive, responsive, and visually clear, they are more likely to engage with it, accomplish their goals efficiently, and return in the future. Poor UX, on the other hand, can lead to frustration, errors, and abandonment.
Key Concepts for Good UX
Responsiveness: The app should react quickly to user actions, providing immediate feedback (e.g., loading spinners during data fetches).
Clarity: Information and controls should be presented clearly, with meaningful labels and instructions.
Consistency: UI elements and interactions should behave predictably throughout the app.
Accessibility: The app should be usable by people with a wide range of abilities and devices.
Error Handling: Inform users when something goes wrong and guide them to resolve issues.
Minimizing Waiting: Similar to responsiveness, use asynchronous operations and loading indicators to keep the interface responsive, even during long-running tasks.
By focusing on these principles, you create an app that feels smooth, professional, and user-friendly, encouraging continued use and satisfaction.
Addressing Current UX Issues
We can address the above issues by doing the following:
Hide the Panel by default
Update the displayed title of the panel to be something more descriptive than "Panel"
Immediately show the panel when the map is clicked
Clearing/hiding the chart and showing a loading spinner while new data is fetched.
Displaying the chart with a title and y-axis label once data is loaded.
Tip
To really solidify all you've been learning, try pushing yourself to tackle some of the above items on your own.
Hint
See the lib.tethys API docs for all possible keyword arguments to Panel and Chart
See the lib.utils API docs for other functions that might be helpful.
Solution
@App.page
def home(lib):
    chart_data, set_chart_data = lib.hooks.use_state(None)
    show_panel, set_show_panel = lib.hooks.use_state(False)

    def get_data_by_coordinate(coordinate):
        lon, lat = lib.utils.transform_coordinate(coordinate, "EPSG:3857", "EPSG:4326")
        data1 = lib.utils.fetch_json(f"https://geoglows.ecmwf.int/api/v2/getriverid?lat={lat}&lon={lon}")
        data2 = lib.utils.fetch_json(f"https://geoglows.ecmwf.int/api/v2/hydroviewer/{data1.river_id}")
        set_chart_data({"river_id": data1.river_id, "series": [{"x": x, "y": y} for x, y in zip(data2.datetime_forecast, data2.flow_median)]})

    def handle_map_click(e):
        set_chart_data(None)
        set_show_panel(True)
        lib.utils.background_execute(get_data_by_coordinate, [e.coordinate])

    return lib.tethys.Display(
        lib.tethys.Map(on_click=handle_map_click)(
            lib.ol.layer.Image(
                options=lib.Props(
                    title="GEOGLOWS Streamflow Service"
                )
            )(
                lib.ol.source.ImageArcGISRest(
                    url="https://livefeeds3.arcgis.com/arcgis/rest/services/GEOGLOWS/GlobalWaterModel_Medium/MapServer"
                )
            ),
        ),
        lib.tethys.Panel(
            show=show_panel,
            on_close=lambda _: set_show_panel(False),
            title="Streamflow",
        )(
            lib.tethys.Chart(data=chart_data["series"], title=f"Streamflow @ {chart_data["river_id"]}", y_label="CFS") if chart_data else lib.bs.Spinner()
        )
    )
Code Analysis
show_panel, set_show_panel = lib.hooks.use_state(False)
A new state variable to control the visibility of the panel. It starts as False, so the panel is hidden by default.
get_data_by_coordinate
The data-fetching logic was moved into its own function so that it can be called on a separate thread.
Details on why will be discussed below in the context of the lib.utils.background_execute function.
set_chart_data({...})
The format of the chart_data state variable was updated to also store data1.river_id so that this could be used in the chart title.
Note
Alternatively, we could have created another new state variables called river_id, but since they are essentially inseparable, it makes sense to simplify and combine them.
This did change how they needed to be referenced when being passed to the Chart, as discussed below.
set_chart_data(None) and set_show_panel(True) in handle_map_click
This updates the chart_data and show_panel state variables and adds a re-render to the processing queue. The re-render will only occur once every other queued process has been complete.
Important
When state variable setter functions return, they have only scheduled a re-render for when the processing queue is freed up - the re-render hasn't actually occurred! This is a common misunderstanding.
This principle is exactly why we moved the core data-fetching logic to its own function that can be executed in the background, as shown and discussed in the next code snippet analysis.
lib.utils.background_execute(get_data_by_coordinate, [e.coordinate])
We moved the core data-fetching logic that was originally in handle_map_click to its own function so that it could be run in the background.
This ensures that the re-render scheduled by the state varaible setter functions discussed above is able to be executed much sooner than it would have been otherwise - nearly immediately!
Important
Sending the data-fetching logic to a background thread immediately frees up the processing queue since each thread has its own queue.
lib.tethys.Panel(show=show_panel, on_close=lambda _: set_show_panel(False), title="Streamflow")
The panel is now controlled by state, and its title is more descriptive.
lib.tethys.Chart(data=chart_data["series"], title=f"Streamflow @ {chart_data["river_id"]}", y_label="CFS") if chart_data else lib.bs.Spinner()
If chart data is available, the chart is rendered with a title and y-axis label. If not, a loading spinner is shown, providing immediate feedback to the user.
View the Results
Save your changes and refresh the browser.
Note the following:
The panel will now be hidden by default.
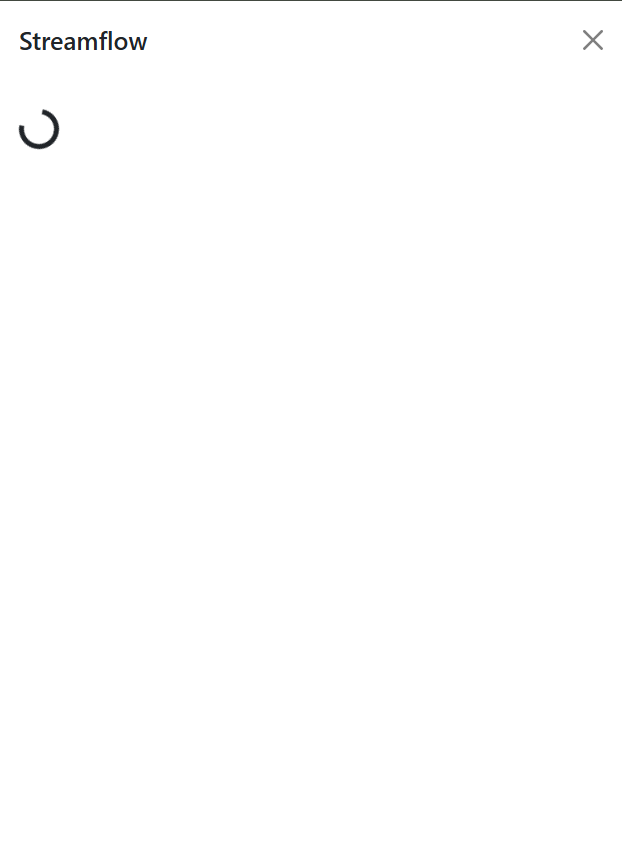
When you click on the map, the panel opens immediately and displays a loading spinner while data is fetched. (See screenshot below)
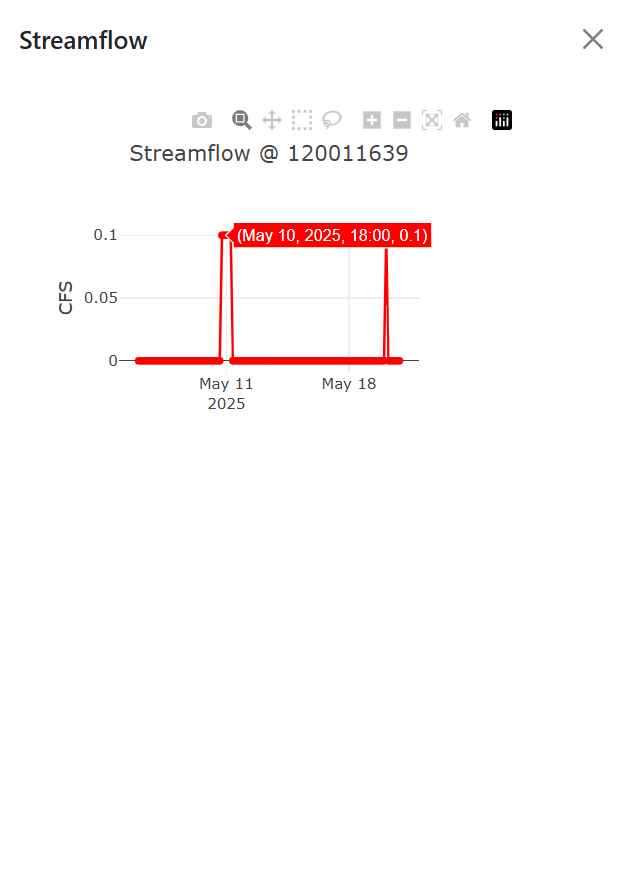
Once the data is ready, the spinner is replaced by a chart with a descriptive title and y-axis label. (See screenshot below)
Key Takeaways
Good UX design ensures your app is intuitive, responsive, and enjoyable to use.
The state variable setter functions only schedule a re-render, but do not perform it.
A re-render only occurs when the main processing queue is freed up
We can free up the main processing queue by sending background tasks to their own thread using
lib.utils.background_execute
Conclusion
That concludes the Component App Basics tutorial!
The concepts and skills you were introduced to provide an important foundation upon which you can build more complex and engaging applications.
Keep experimenting and building — you're well on your way to mastering interactive Component App development!