Components and Component-Based Development
Let's take a look at the concept of components and how component-based development can help you build modular, reusable, and maintainable applications.
In this tutorial, you will learn:
What components are and why they are useful
How to create and use components in your application
Best practices for component-based development
Let's get started!
Components
A component is a self-contained unit of functionality that directly represents a visual object rendered on a web page. These can be as simple or as complex as needed, ranging from buttons and input fields to interactive maps and data tables. No matter the complexity, each component encapsulates its own logic, structure, and styling.
The core idea, however, is that complex components can be built from simpler ones. By composing components together, you can create sophisticated user interfaces while keeping each part of your codebase focused and manageable.
In Tethys, components are implemented as Python functions that generate the necessary HTML, CSS, and JavaScript for the web interface. Tethys Platform provides access to a vast amount of pre-built components via its Tethys Component App Page Library and makes it easy to add additional ReactJS comopnent libraries that are not already included.
Apps and Pages as Components
Apps and Pages can be thought of as components themselves, where an App component consists of one or more Page components. Each Page component, in turn, is composed of smaller UI components such as buttons, maps, and tables. This hierarchical structure allows you to build complex applications by assembling and nesting components at different levels.
The Content Tree
This hierarchical relationship between components and the components that they are composed of will be referred throughout this tutorial as a content tree.
The content tree for new app project you created in the past steps conceptually looks like this:
- App
- Page
Header
HamburgerIcon
Icon
AppTitle
SettingsIcon
ExitIcon
- NavigationPanel
NavLink
- Content
- Display
Map
The Page Component
By decorating a function with the App.page decorator, you are adding another Page component to your App.
Based on the settings in the App class, each Page comes pre-composed with a number of other components, such as a Header and a Navbar, and a Content component.
This is where you come in: the developer. You determine what is displayed in your app. Whatever is returned by your page functions represents the component-based content that will be rendered when a user navigates to that page.
Note
The App.page decorator also handles routing, so each decorated function is automatically mapped to a URL endpoint within your app. This makes it easy to add new pages by simply creating new functions and decorating them with App.page.
Back to Development
Let's take another look at the home page function of the app you created in the last steps.
@App.page
def home(lib):
    return lib.tethys.Display(
        lib.tethys.Map()
    )
The content tree being returned by this function is a Display component that itself is composed of a Map component.
Note the following:
The
lib.tethysnamespace is used to access theDisplayandMapcomponents. There are other namespaced modules available on thelibobject which we will introduce to you soon.The
lib.tethys.Displaycomponent in this example is called with a single argument: thelib.tethys.Mapcomponent. Many components can nest other components, which renders them inside of the parent component. In this case, thelib.tethys.Mapcomponent is rendered inside of thelib.tethys.Displaycomponent, which is essentially just a special container for nesting other components.The
lib.tethys.Mapcomponent in this example takes no arguments, so it will use the default settings which include a basic basemap and standard controls. Most components accept various keyword arguments to customize their behavior and appearance, which you will learn about in the next sections of this tutorial.
The Display component is quite a simple component, which itself is just made up of an HTML div - basically an empty container for holding other things.
The Map component, on the other hand, is quite complex. Right out of the box this component provides a fully interactive map interface with support for panning, zooming, multiple projections, and a variety of built-in controls such as layer toggles, scale lines, and full-screen mode. It is designed to be highly extensible, allowing you to add layers, controls, and event handlers to customize the map's behavior and appearance to fit your application's needs.
Enhancing Components with Nested Children
You can further enhance the Map component by nesting additional children components, such as layers for displaying geospatial data, controls for user interaction, and popups for displaying information. This modular approach makes it easy to build powerful mapping interfaces without having to manage the low-level details yourself.
Adding Geospatial Data to the Map
Let's enhance our Map component by adding geospatial data to it. This can be done by nesting a new Layer component within the Map.
This layer component will come from the lib.ol module (where ol refers to OpenLayers).
Geospatial data can come from a variety of sources and in a variety of formats. For this tutorial, we are interested in adding the data hosted as an ArcGIS REST Map Service here: https://livefeeds3.arcgis.com/arcgis/rest/services/GEOGLOWS/GlobalWaterModel_Medium/MapServer.
To add an ArcGIS REST Map Service layer to your map, you'll use the lib.ol.layer.Image component, nesting it as a child of the lib.tethys.Map component, like so:
@App.page
def home(lib):
    return lib.tethys.Display(
        lib.tethys.Map(
            lib.ol.layer.Image(
                options=lib.Props(
                    title="GEOGLOWS Streamflow Service"
                )
            )(
                lib.ol.source.ImageArcGISRest(
                    url='https://livefeeds3.arcgis.com/arcgis/rest/services/GEOGLOWS/GlobalWaterModel_Medium/MapServer'
                )
            )
        )
    )
Code Analysis
The lib.ol module provides Pythonic access to PlanetLabs' declarative component wrapper around OpenLayers.
This mouthful simply means that with lib.ol you are indirectly accessing much of the OpenLayers API, but with Python!
Note
You will be able to glean much about Converting HTML/JSX to Python through this hands-on tutorial, but you may want to visit that link for more direct and consolidated information.
The lib.ol.layer.Image component:
Accepts an
optionskeyword argument that takes atitleproperty, which will be displayed in the layer toggle that is automatically generated under the Map's layer control menu (see screenshot below)Requires a nested layer source component. Because we're adding an ArcGIS REST Map Server, we use the corresponding
lib.ol.source.ImageArcGISRestcomponent as the child of the Layer.
The lib.ol.source.ImageArcGISRest component:
Accepts a
urlkeyword argument. The provided value will of course be used to connect to the data feed and fetch our geospatial data of interest.
Important
Note the nuanced difference in syntax between all of the components in the component tree returned by the home function.
Props and children can be passed directly as kwargs or args, respectively, if the component only needs one or the other.
If the component needs both, the kwargs get passed as direct arguments of the component function, while the children get passed as arguments to a second, chained call of the component function.
Component(arg1="val1")
vs
Component(ChildComponent())
vs
Component(arg1="val1")(ChildComponent())
Make sure you save the app.py file, which should automatically restart your server.
Now return to the browser and refresh the page to view the rendered changes, which should look something like this:
Note
The rendered geospatial data will likely look different since it's coming from a live service that updates frequently based on modeled environmental conditions.

Your map is now rendering geospatial data that represents modeled Streamflow across the globe. If you click on the map's layer icon in the upper-left corner, it will expand out to a panel that displays the map's Layer Overlays - which now includes the "GEOGLOWS Streamflow Service" entry. You can toggle on/off the checkbox to show/hide the layer on the map.
Now that we have our geospatial data added to the map, it's natural to want to add additional interactivity to explore the data.
Our ultimate goal is that users can click on the map to pull up a chart that plots the actual forecast data associated with associated geospatial feature they selected.
The next step toward that end will be to add a side panel to the app that can display our chart.
Add a Panel with a Chart
We should be able to move quickly through this section now that we're getting the hang of component-based App development.
In addition to the Display and Map components, the lib.tethys module also has both a Panel and Chart component that can quickly get us what we're looking for - a panel containing a chart!
Here's the new code:
@App.page
def home(lib):
    return lib.tethys.Display(
        lib.tethys.Map(
            lib.ol.layer.Image(
                options=lib.Props(
                    title="GEOGLOWS Streamflow Service"
                )
            )(
                lib.ol.source.ImageArcGISRest(
                    url='https://livefeeds3.arcgis.com/arcgis/rest/services/GEOGLOWS/GlobalWaterModel_Medium/MapServer'
                )
            ),
        ),  # New code starts here
        lib.tethys.Panel(
            lib.tethys.Chart()
        )
    )
Much like the original Map component, no arguments are being passed to these components, which means they will render with their defaults.
That is fine for now.
Save the app.py and refresh your browser after the server automatically reloads. You should see something like the following:
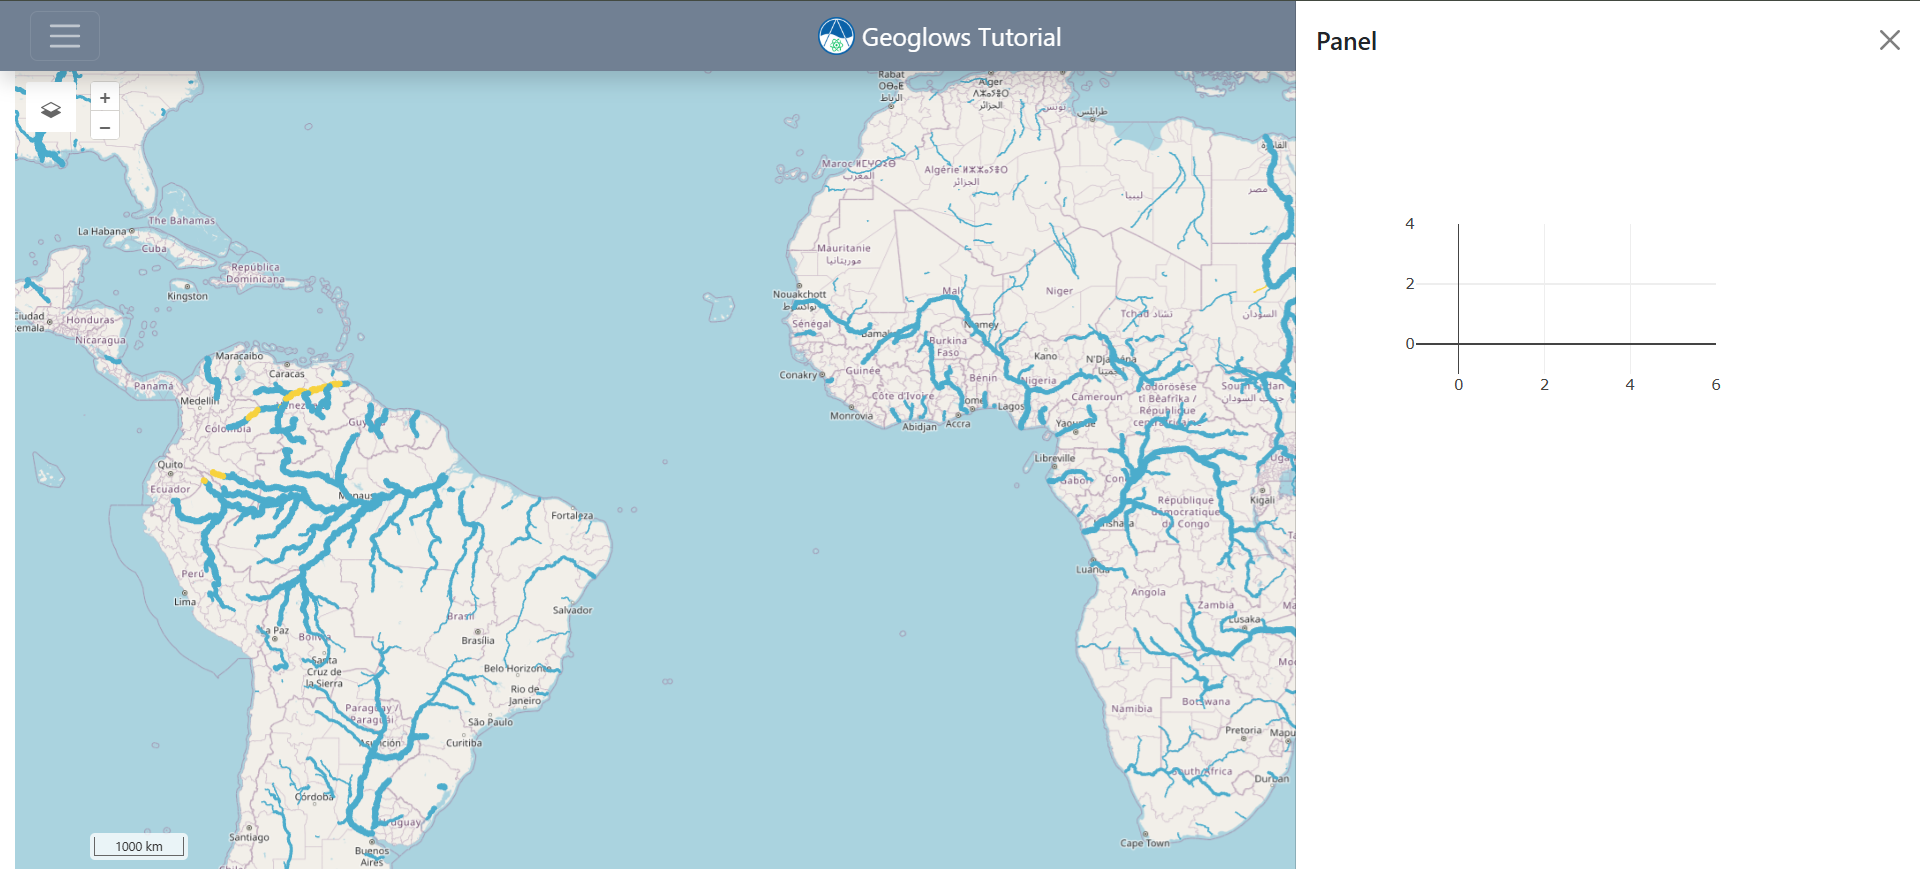
The panel renders by default anchored to the right edge of the page, overlaying the content below. A couple of important things to point out:
The panel has an "X" icon in the top right that does nothing. We will need to program it to hide the panel. We also will not want the panel showing by default. Remember, our goal is to pull it up by clicking a feature on the map.
The chart does not look at all like a chart. It's currently more of a placeholder for a chart. This is because we haven't added data to it. Remember, we plan for that same map click to initiate a process that fetches the relevant data and adds it to the chart.
If you hadn't guessed, our next step will be adding some additional interactivity to the app by triggering updates with a map click. Let's get to it!
Key Takeaways
Components are self-contained units of functionality that encapsulate logic, structure, and styling.
Complex user interfaces are built by composing and nesting components, forming a content tree.
In Tethys, components are Python functions that generate HTML, CSS, and JavaScript for the web interface.
Pages and apps themselves are components, composed of smaller UI components.
The
lib.tethysandlib.olmodules provide access to a wide range of pre-built and extensible components.Components can be enhanced by nesting children components, such as adding layers to maps or charts to panels.