Add Spatial Data to Map Layout
Last Updated: July 2024
In this tutorial you will learn how to visualize GeoJSON data in your Tethys app, building on Map Layout concepts
0. Start From Previous Solution (Optional)
If you wish to use the previous solution as a starting point:
git clone https://github.com/tethysplatform/tethysapp-map_layout_tutorial
cd tethysapp-map_layout_tutorial
git checkout -b data-prep-solution data-prep-solution-4.5
You'll also need to do the following:
Download the solution version of the sample NextGen data used in this tutorial: sample_nextgen_data_solution.zip.
Save to
$TETHYS_HOME/workspaces/map_layout_tutorial/app_workspaceUnzip the contents to the same location
Delete the zip file
Rename the
sample_nextgen_data_solutiontosample_nextgen_data(i.e. remove "_solution")
1. Override compose_layers function of MapLayout
Adding data to the map you created two sections ago using the Tethys Map Layout feature is simple. To do so, you are required to override the compose_layers function, copying its expected signatures (i.e. arguments) and returning a list of layer groups. Let's take a look at what a functional, complete implementation will look like and then dive into the details.
Replace controller.py with the following:
import json
from pathlib import Path
from tethys_sdk.layouts import MapLayout
from tethys_sdk.routing import controller
from .app import App


@controller(name="home", app_workspace=True)
class MapLayoutTutorialMap(MapLayout):
    app = App
    base_template = 'map_layout_tutorial/base.html'
    map_title = 'Map Layout Tutorial'
    map_subtitle = 'NOAA-OWP NextGen Model Outputs'

    def compose_layers(self, request, map_view, app_workspace, *args, **kwargs):
        """
        Add layers to the MapLayout and create associated layer group objects.
        """
        # Load GeoJSON from files
        config_directory = Path(app_workspace.path) / 'sample_nextgen_data' / 'config'

        # Nexus Points
        nexus_path = config_directory / 'nexus_4326.geojson'
        with open(nexus_path) as nf:
            nexus_geojson = json.loads(nf.read())

        nexus_layer = self.build_geojson_layer(
            geojson=nexus_geojson,
            layer_name='nexus',
            layer_title='Nexus',
            layer_variable='nexus',
            visible=True,
            selectable=True,
            plottable=True,
        )

        # Catchments
        catchments_path = config_directory / 'catchments_4326.geojson'
        with open(catchments_path) as cf:
            catchments_geojson = json.loads(cf.read())

        catchments_layer = self.build_geojson_layer(
            geojson=catchments_geojson,
            layer_name='catchments',
            layer_title='Catchments',
            layer_variable='catchments',
            visible=True,
            selectable=True,
            plottable=True,
        )

        # Create layer groups
        layer_groups = [
            self.build_layer_group(
                id='ngen-features',
                display_name='NGen Features',
                layer_control='checkbox',  # 'checkbox' or 'radio'
                layers=[
                    nexus_layer,
                    catchments_layer,
                ]
            )
        ]

        return layer_groups
Let's take a closer look at the changes we made to controllers.py:
There are new imported packages
import json
from pathlib import Path
The json package will be used to read in the .geojson files that we reviewed and reprojectd in the last section.
The path package will allow us to code the file paths to those .geojson files
The compose_layers function was added
Here's a closer look at that function:
def compose_layers(self, request, map_view, app_workspace, *args, **kwargs):
    """
    Add layers to the MapLayout and create associated layer group objects.
    """
    # Load GeoJSON from files
    config_directory = Path(app_workspace.path) / 'sample_nextgen_data' / 'config'

    # Nexus Points
    nexus_path = config_directory / 'nexus_4326.geojson'
    with open(nexus_path) as nf:
        nexus_geojson = json.loads(nf.read())

    nexus_layer = self.build_geojson_layer(
        geojson=nexus_geojson,
        layer_name='nexus',
        layer_title='Nexus',
        layer_variable='nexus',
        visible=True,
        selectable=True,
        plottable=True,
    )

    # Catchments
    catchments_path = config_directory / 'catchments_4326.geojson'
    with open(catchments_path) as cf:
        catchments_geojson = json.loads(cf.read())

    catchments_layer = self.build_geojson_layer(
        geojson=catchments_geojson,
        layer_name='catchments',
        layer_title='Catchments',
        layer_variable='catchments',
        visible=True,
        selectable=True,
        plottable=True,
    )

    # Create layer groups
    layer_groups = [
        self.build_layer_group(
            id='nextgen-features',
            display_name='NextGen Features',
            layer_control='checkbox',  # 'checkbox' or 'radio'
            layers=[
                nexus_layer,
                catchments_layer,
            ]
        )
    ]

    return layer_groups
This function is passed three standard arguments: request, map_view, app_workspace. In our case, we only need to use the app_workspace variable, as that is where we stored our sample NextGen GeoJSON files.
For both the nexus data and the catchments data, you'll note the following:
The path to the
.geojsonfile are composed relative to theapp_workspacedirectory using thePathclassThe
jsonpackage is used to open and read the GeoJSON data, since GeoJSON is just a flavor of standard JSONThe layers are configured using the built-in method of the MapLayout class called
build_geojson_layer. Appropriate arguments are provided to define how the layer will be handled by the application:
layer_name: A unique identifier for this layer, important for identifying the layer later in other parts of the code.
layer_title: What the layer should be titled (i.e. displayed as) in the left Layers panel of the application
layer_variable: This is used as a way to group similar layers, but won't be used further in this tutorial.
visible: Whether or not the layer is visible by default when the application loads
selectable: Whether or not the individual features of the layer can be selected
plottable: Whether or not the individual layers can be considered for plotting
The
layer_groupslist is composed using the built-in method of the MapLayout class calledbuild_layer_groups. Appropriate arguments are provided to define how the layer group will be handled by the application:
id: For use in code (not applicable to this tutorial beyond its definition)
diplay_name: What the layer group should be titled (i.e. displayed as) in the left Layers panel of the application
layer_control: What control should be used to toggle the layers on and off. You can choose
checkboxfor multi-layering orradiofor isolated layer viewing.layers: The list of layers as created by the
build_geojson_layerfunction that should be included in this layer group. They will be displayed together in the left Layers panel of the application.
Return to your application at <http://localhost:8000/apps/map-layout-tutorial/>_ to view the results.
You'll note that everything shows up just as it was configured - you now have a Layers panel and your data is rendering on the map! You can play around with the options in the Layers panel, such as checking on and off the layers or group or exploring the three dot menu options of adjusting the opacity or zooming to the layers.
You'll also note that the default zoom and extent of our map leaves something to be desired. You can easily zoom into the data to get a closer look, but wouldn't it be nice if we could have the data centered in our view at page load? Let's do that now.
2. Adjust the map's default zoom and extent
As mentioned, it would be nice if our application would load with the data already zoomed to and centered on in the map. It would also be nice if we could set some constraints to prevent users from zooming in too close or too far away.
Solve the problem by adding the following properties to our MapLayoutTutorialMap class, just below the map_subtitle property:
class MapLayoutTutorialMap(MapLayout):
    ...
    ...
    ...
    default_map_extent = [-87.83371926334216, 33.73443611122197, -86.20833410475134, 34.456557011634175]
    max_zoom = 14
    min_zoom = 9
Tip
To get the value for default_map_extent you can actually play around with the zoom manually in your application, and once you find the zoom you want, type CTRL-SHIFT-J to bring up the JavaScript console and enter the following:
ol.proj.transformExtent(TETHYS_MAP_VIEW.getMap().getView().calculateExtent(TETHYS_MAP_VIEW.getMap().getSize()), 'EPSG:3857', 'EPSG:4326')
To get the zoom at that extent, you can execute the following:
TETHYS_MAP_VIEW.getMap().getView().getZoom()
You can then add and subtract a few from this value to get your min_zoom and max_zoom range
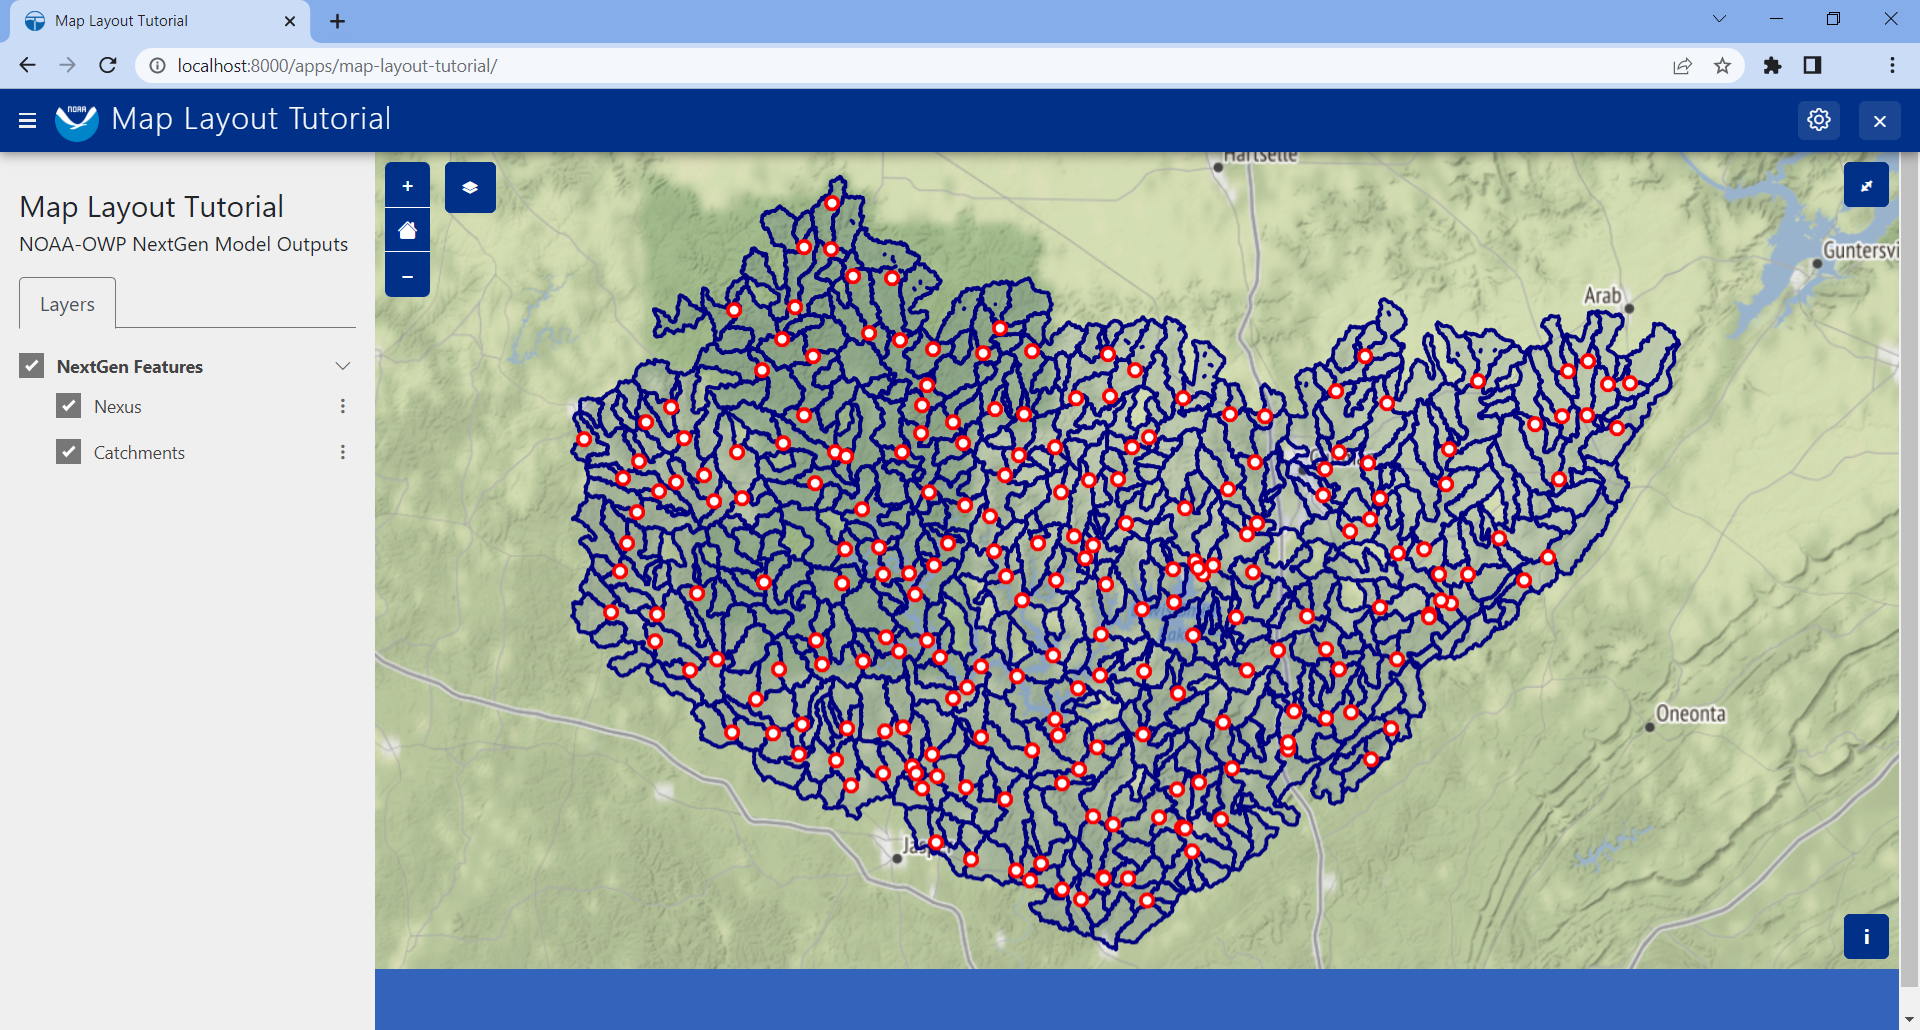
Now if you reload your map, our NextGen data will be centered and focused from the get-go. The zooming will also be contrained within the bounds we set. However, with the data now centered, we realize that there is something else to be desired: the symbology. The default rendering styles for these layers makes them look nearly identical. We can add a bit of code to have full control over how the data is rendered.
3. Adjust the layer styles
Replace your controllers.py with the following:
import json
from pathlib import Path
from tethys_sdk.layouts import MapLayout
from tethys_sdk.routing import controller
from .app import App


@controller(name="home", app_workspace=True)
class MapLayoutTutorialMap(MapLayout):
    app = App
    base_template = 'map_layout_tutorial/base.html'
    map_title = 'Map Layout Tutorial'
    map_subtitle = 'NOAA-OWP NextGen Model Outputs'
    default_map_extent = [-87.83371926334216, 33.73443611122197, -86.20833410475134, 34.456557011634175]
    max_zoom = 14
    min_zoom = 9

    def compose_layers(self, request, map_view, app_workspace, *args, **kwargs):
        """
        Add layers to the MapLayout and create associated layer group objects.
        """
        # Load GeoJSON from files
        config_directory = Path(app_workspace.path) / 'sample_nextgen_data' / 'config'

        # Nexus Points
        nexus_path = config_directory / 'nexus_4326.geojson'
        with open(nexus_path) as nf:
            nexus_geojson = json.loads(nf.read())

        nexus_layer = self.build_geojson_layer(
            geojson=nexus_geojson,
            layer_name='nexus',
            layer_title='Nexus',
            layer_variable='nexus',
            visible=True,
            selectable=True,
        )

        # Catchments
        catchments_path = config_directory / 'catchments_4326.geojson'
        with open(catchments_path) as cf:
            catchments_geojson = json.loads(cf.read())

        catchments_layer = self.build_geojson_layer(
            geojson=catchments_geojson,
            layer_name='catchments',
            layer_title='Catchments',
            layer_variable='catchments',
            visible=True,
            selectable=True,
        )

        # Create layer groups
        layer_groups = [
            self.build_layer_group(
                id='nextgen-features',
                display_name='NextGen Features',
                layer_control='checkbox',  # 'checkbox' or 'radio'
                layers=[
                    nexus_layer,
                    catchments_layer,
                ]
            )
        ]

        return layer_groups

    @classmethod
    def get_vector_style_map(cls):
        return {
            'Point': {'ol.style.Style': {
                'image': {'ol.style.Circle': {
                    'radius': 5,
                    'fill': {'ol.style.Fill': {
                        'color': 'white',
                    }},
                    'stroke': {'ol.style.Stroke': {
                        'color': 'red',
                        'width': 3
                    }}
                }}
            }},
            'MultiPolygon': {'ol.style.Style': {
                'stroke': {'ol.style.Stroke': {
                    'color': 'navy',
                    'width': 3
                }},
                'fill': {'ol.style.Fill': {
                    'color': 'rgba(0, 25, 128, 0.1)'
                }}
            }},
        }
Let's take a closer look at what changed:
There's a new
get_vector_style_mapclass method implemented. Here's a closer look at that:
@classmethod
def get_vector_style_map(cls):
    return {
        'Point': {'ol.style.Style': {
            'image': {'ol.style.Circle': {
                'radius': 5,
                'fill': {'ol.style.Fill': {
                    'color': 'white',
                }},
                'stroke': {'ol.style.Stroke': {
                    'color': 'red',
                    'width': 3
                }}
            }}
        }},
        'MultiPolygon': {'ol.style.Style': {
            'stroke': {'ol.style.Stroke': {
                'color': 'navy',
                'width': 3
            }},
            'fill': {'ol.style.Fill': {
                'color': 'rgba(0, 25, 128, 0.1)'
            }}
        }},
    }
This method simply returns a dictionary with key values being the geometry type of interest and the value being a Python dictionary representation of an OpenLayers Style object.
Tip
Learn more about the OpenLayers Style format OpenLayers API: ol/style/Style.
You can play around with all of the different colors and widths to get things exactly as you like them. If you choose to keep the defaults provided, your application should end up loading exactly as it looks in the screenshot at the top of this section.
4. Solution
This concludes the Add Spatial Data portion of the Map Layout Tutorial. You can view the solution on GitHub at https://github.com/tethysplatform/tethysapp-map_layout_tutorial/tree/add-spatial-data-solution or clone it as follows:
git clone https://github.com/tethysplatform/tethysapp-map_layout_tutorial
cd tethysapp-map_layout_tutorial
git checkout -b add-spatial-data-solution add-spatial-data-solution-4.5
You'll also need to do the following:
Download the solution version of the sample NextGen data used in this tutorial: sample_nextgen_data_solution.zip.
Save to
$TETHYS_HOME/workspaces/map_layout_tutorial/app_workspaceUnzip the contents to the same location
Delete the zip file
Rename the
sample_nextgen_data_solutiontosample_nextgen_data(i.e. remove "_solution")