Setup Scheduler
Last Updated: November 2019
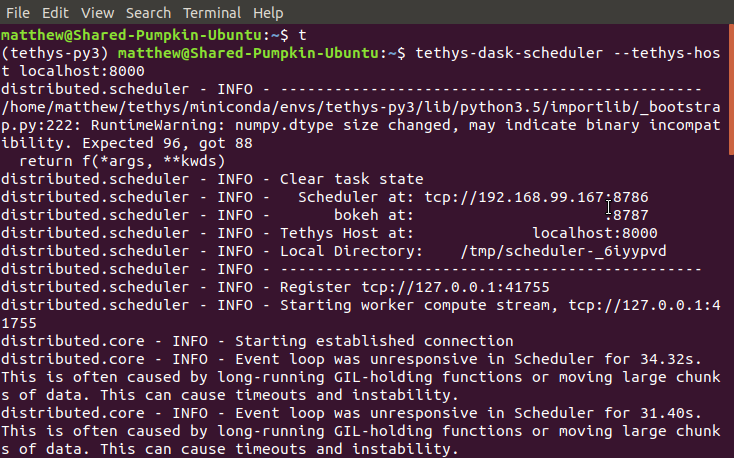
1. Start Scheduler
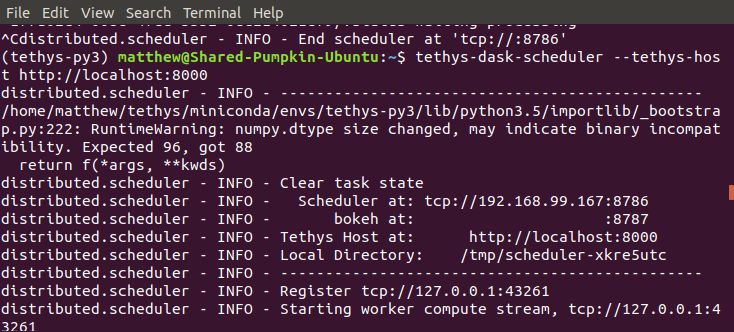
Open up a new terminal and make sure the tethys environment is activated (start it we the command t if not). To start the Dask scheduler run:
tethys-dask-scheduler --tethys-host <tethys-host>
<tethys-host> is the host of the Tethys server you'd like to link this scheduler with (i.e.: http://localhost:8000).
Tip
Do not leave out the protocol when specifying ''tethys_host'' address.
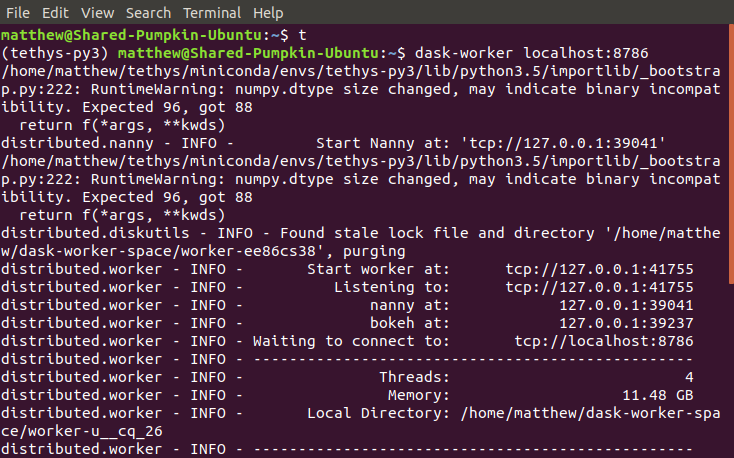
2. Start Worker
Open up a new terminal and make sure the tethys environment is activated. To start the worker run:
dask-worker <scheduler-host>
<scheduler-host> should be the same as the scheduler-at field from the previous command (e.g.: tcp://192.168.1.17:8786).
3. Log in to Tethys
Log in to tethys. For this tutorial use the username admin and the password pass.
4. Go to Site Admin
Use the drop down menu in the top right corner near your username to navigate to the Site Admin page.
Note
If you are in an app, you will need to exit to the App Library page to access the drop down.
5. Dask Schedulers
Scroll down to the Tethys Computing sub group and select Dask Scheduler to navigate to the Dask Scheduler page.
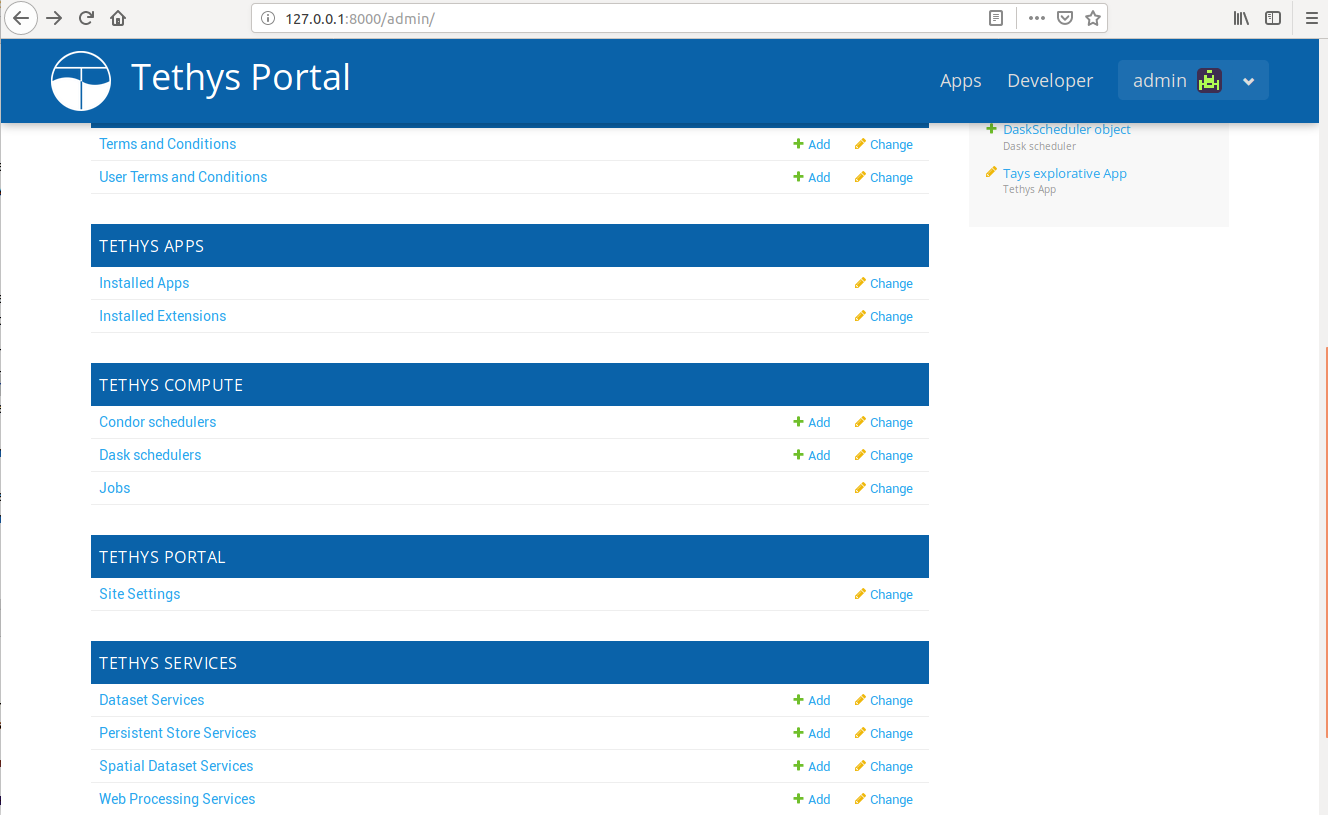
6. Add a New Dask Scheduler
Select the Add Dask Scheduler button. Fill out the following form to create a new scheduler. Use the name test_scheduler for this tutorial. For host and port see the scheduler terminal. Use the scheduler at value (e.g.: 192.168.1.17:8786) for the Host field. Use the bokeh at port with the scheduler at host (e.g.: 192.168.1.17:8787) for Dashboard field, using the same host as the scheduler. Select Save once done.
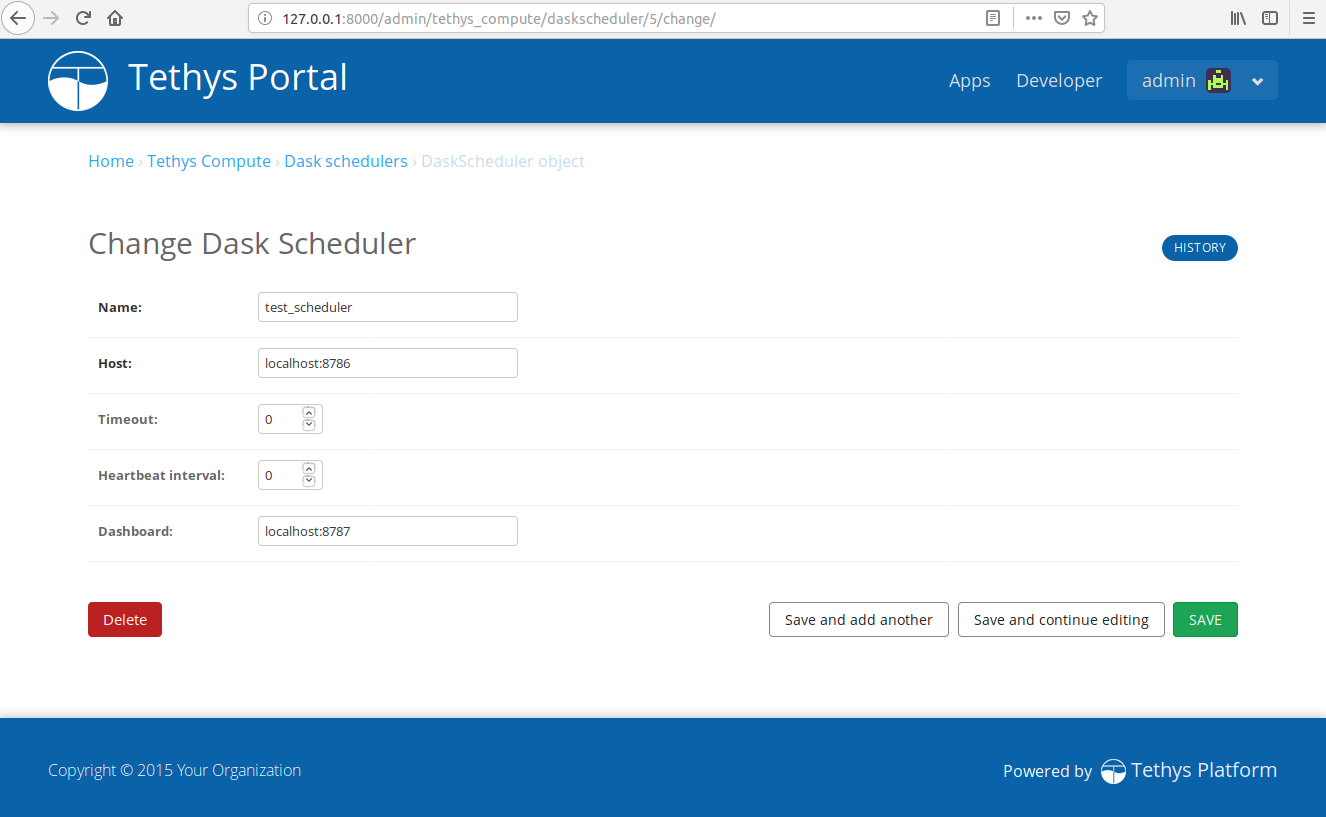
Tip
Don't include the protocol (i.e.: tcp://) when specifying the Host and Dashboard fields.
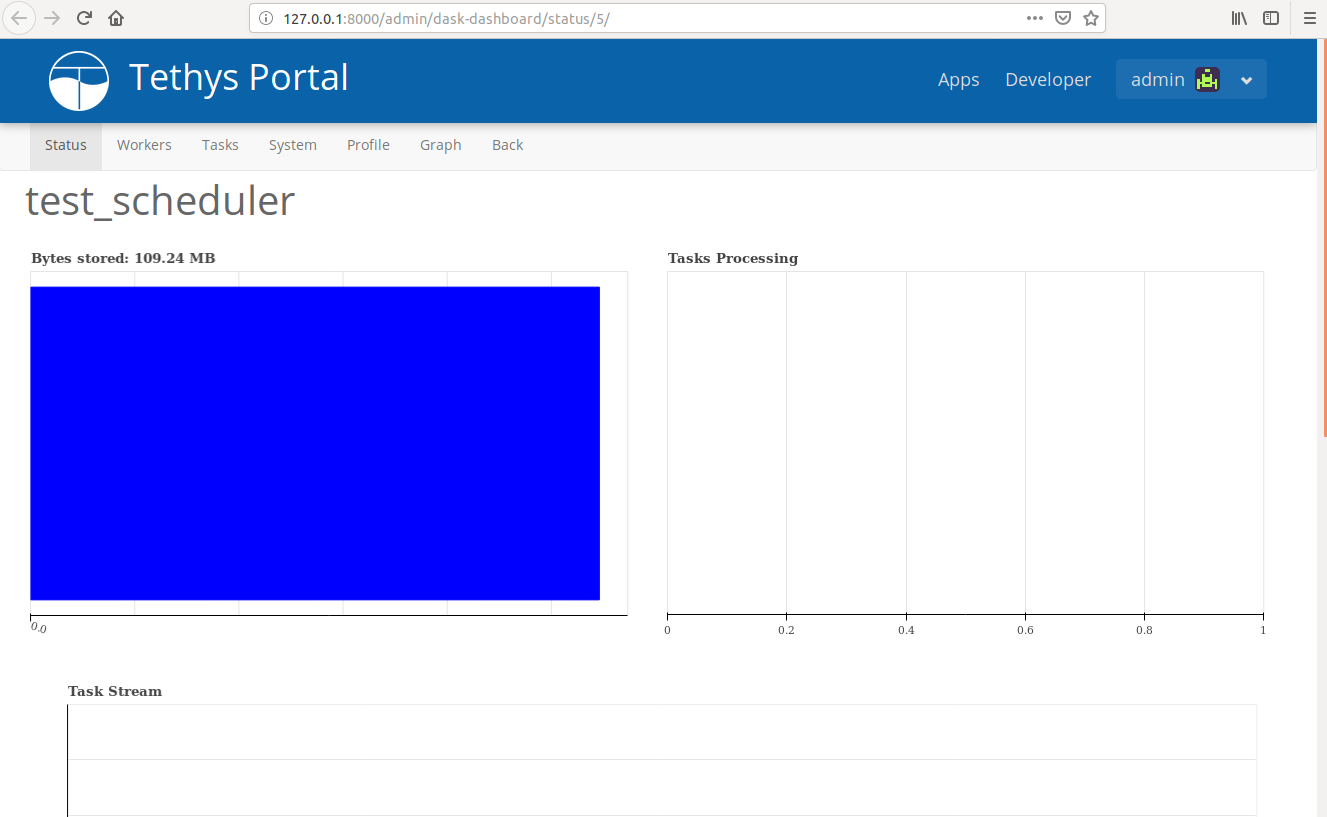
7. View Embedded Dashboard
Select the Launch Dashboard link to the right of your newly created dashboard to visit your embedded Dashboard. It should look like this.