Plot Time Series at Location
Last Updated: July 2024
In this tutorial you will add a tool for querying the active THREDDS dataset for time series data at a location and display it on a plot. Topics covered in this tutorial include:
0. Start From Previous Solution (Optional)
If you wish to use the previous solution as a starting point:
git clone https://github.com/tethysplatform/tethysapp-thredds_tutorial
cd tethysapp-thredds_tutorial
git checkout -b visualize-leaflet-solution visualize-leaflet-solution-4.5
1. Add Drawing Tool to Map
In this step you'll learn to use another Leaflet plugin: Leaflet.Draw. This plugin adds a toolbar of controls for drawing different shapes on the map, including a point/marker tool. You'll implement the plot at location tool using the marker tool and bind to its on-draw event to load the plot for that location.
Include Leaflet Draw scripts and stylesheets in
templates/thredds_tutorial/home.html:
{% block styles %}
  {{ block.super }}
  <link rel="stylesheet" href="https://unpkg.com/leaflet@1.8.0/dist/leaflet.css"
   integrity="sha512-hoalWLoI8r4UszCkZ5kL8vayOGVae1oxXe/2A4AO6J9+580uKHDO3JdHb7NzwwzK5xr/Fs0W40kiNHxM9vyTtQ=="
   crossorigin=""/>
  <link rel="stylesheet" href="https://cdn.jsdelivr.net/npm/leaflet-timedimension@1.1.1/dist/leaflet.timedimension.control.min.css" />
  <link rel="stylesheet" href="https://cdnjs.cloudflare.com/ajax/libs/leaflet.draw/0.4.2/leaflet.draw.css"/>
  <link rel="stylesheet" href="{% static tethys_app|public:'css/leaflet_map.css' %}"/>
  <link rel="stylesheet" href="{% static tethys_app|public:'css/loader.css' %}" />
{% endblock %}

{% block global_scripts %}
  {{ block.super }}
  <script src="https://unpkg.com/leaflet@1.8.0/dist/leaflet.js"
   integrity="sha512-BB3hKbKWOc9Ez/TAwyWxNXeoV9c1v6FIeYiBieIWkpLjauysF18NzgR1MBNBXf8/KABdlkX68nAhlwcDFLGPCQ=="
   crossorigin=""></script>
  <script type="text/javascript" src="https://cdn.jsdelivr.net/npm/iso8601-js-period@0.2.1/iso8601.min.js"></script>
  <script type="text/javascript" src="https://cdn.jsdelivr.net/npm/leaflet-timedimension@1.1.1/dist/leaflet.timedimension.min.js"></script>
  <script src="https://cdnjs.cloudflare.com/ajax/libs/leaflet.draw/0.4.2/leaflet.draw.js"></script>
{% endblock %}
Add the following new variables to the MODULE LEVEL / GLOBAL VARIABLES section of
public/js/leafet_map.js:
var m_drawn_features; // Layer for drawn items
Add the following module function declarations to the PRIVATE FUNCTION DECLARATIONS section of
public/js/leafet_map.js:
// Plot Methods
var init_plot_at_location;
The Leaflet.Draw toolbar can be customized to show or hide controls as desired. Since the plot at location tool will use the draw toolbar, you'll initialize it as part of the intialization of the plot at location tool. Add the
init_plot_at_locationmethod after thehide_loadermethod inpublic/js/leaflet_map.js:
// Plot Methods
init_plot_at_location = function() {
    // Initialize layer for drawn features
    m_drawn_features = new L.FeatureGroup();
    m_map.addLayer(m_drawn_features);

    // Initialize draw controls
    let draw_control = new L.Control.Draw({
        draw: {
            polyline: false,
            polygon: false,
            circle: false,
            rectangle: false,
        }
    });

    m_map.addControl(draw_control);

    // Bind to draw event
    m_map.on(L.Draw.Event.CREATED, function(e) {
        // Remove all layers (only show one location at a time)
        m_drawn_features.clearLayers();

        // Add layer with the new features
        let new_features_layer = e.layer;
        m_drawn_features.addLayer(new_features_layer);
    });
};
Call
init_plot_at_locationduring initialization ofpublic/js/leaflet_map.js. Replace the INITIALIZATION / CONSTRUCTOR section ofpublic/js/leafet_map.jswith the following updated implementation:
/************************************************************************
*                  INITIALIZATION / CONSTRUCTOR
*************************************************************************/

// Initialization: jQuery function that gets called when
// the DOM tree finishes loading
$(function() {
    init_map();
    init_controls();
    init_plot_at_location();
});
Verify that the drawing tool has been added to the map. Browse to http://localhost:8000/apps/thredds-tutorial in a web browser and login if necessary. A single tool for drawing markers/points should appear near the top left-hand corner of the map, just below the zoom controls.
2. Install Plotly
In the next step you will create a new controller that will query the dataset at the given location using the NCSS service and then build a plotly plot with the results.
The Plotly View gizmo requires the plotly Python package. We'll also need geojson to handle the geometry data amd simplejson for error handling. Install plotly, geojson, and simplejson as follows running the following command in the terminal:
# with conda
conda install plotly
conda install geojson
conda install simplejson

# with pip
pip install plotly
pip install geojson
pip install simplejson
The app now depends on plotly and geojson, so add them to the install.yml file:
dependencies:
  ...
  - plotly
  - geojson
  - simplejson
3. Create New Plot Controller
In this step you will create a new controller that will query the dataset at the given location using the NCSS service and then build a plotly plot with the results.
Add two new methods to the
thredds_methods.pymodule:
from datetime import datetime, timedelta
def find_dataset(catalog, dataset):
    """
    Recursively search a TDSCatalog for a dataset with the given name.

    Args:
        catalog(siphon.catalog.TDSCatalog): A Siphon catalog object bound to a valid THREDDS service.
        dataset(str): The name of the dataset to find.

    Returns:
        siphon.catalog.Dataset: The catalog dataset object or None if not found.
    """
    if dataset in catalog.datasets:
        return catalog.datasets[dataset]

    for catalog_name, catalog_obj in catalog.catalog_refs.items():
        d = find_dataset(catalog_obj.follow(), dataset)
        if d is not None:
            return d

    return None
def extract_time_series_at_location(catalog, geometry, dataset, variable, start_time=None, end_time=None,
                                    vertical_level=None):
    """
    Extract a time series from a THREDDS dataset at the given location.

    Args:
        catalog(siphon.catalog.TDSCatalog): a Siphon catalog object bound to a valid THREDDS service.
        geometry(geojson): A geojson object representing the location.
        dataset(str): Name of the dataset to query.
        variable(str): Name of the variable to query.
        start_time(datetime): Start of time range to query. Defaults to datetime.datetime.now(datetime.UTC).
        end_time(datetime): End of time range to query. Defaults to 7 days after start_time.
        vertical_level(number): The vertical level to query. Defaults to 100000.

    Returns:
        netCDF5.Dataset: The data from the NCSS query.
    """
    try:
        d = find_dataset(catalog, dataset)
        ncss = d.subset()
        query = ncss.query()

        # Filter by location
        coordinates = geometry.geometry.coordinates
        query.lonlat_point(coordinates[0], coordinates[1])

        # Filter by time
        if start_time is None:
            start_time = datetime.datetime.now(datetime.UTC)

        if end_time is None:
            end_time = start_time + timedelta(days=7)

        query.time_range(start_time, end_time)

        # Filter by variable
        query.variables(variable).accept('netcdf')

        # Filter by vertical level
        if vertical_level is not None:
            query.vertical_level(vertical_level)
        else:
            query.vertical_level(100000)

        # Get the data
        data = ncss.get_data(query)

    except OSError as e:
        if 'NetCDF: Unknown file format' in str(e):
            raise ValueError("We're sorry, but we don't support querying this type of dataset at this time. "
                             "Please try another dataset.")
        else:
            raise e

    return data
Note
The find_dataset method is another recursive function similar to the parse_datasets function, except that it searches for and returns a single dataset with the name given.
The extract_time_series_at_location method uses the NetCDF Subset Service (NCSS) to subset the dataset, in this case at a specific location over a period of time.
Create a new function that will generate the Plotly figure in a new Python module,
figure.py:
from plotly import graph_objs as go
from netCDF4 import num2date


def generate_figure(time_series, dataset, variable):
    """
    Generate a figure from a netCDF4.Dataset.

    Args:
        time_series(netCDF4.Dataset): A time series NetCDF4 Dataset.
        dataset(str): The name of the time series dataset.
        variable(str): The name of the variable to plot.
    """
    figure_data = []
    figure_title = dataset

    column_name = variable.replace('_', ' ').title()

    yaxis_title = column_name
    series_name = column_name

    # Add units to yaxis title
    variable_units = time_series.variables[variable].units
    if variable_units:
        yaxis_title += f' ({variable_units})'

    # Extract needed arrays for plot from NetCDF4 Dataset
    variable_array = time_series.variables[variable][:].squeeze()
    time = time_series.variables['time']
    time_array = num2date(time[:].squeeze(), time.units)

    series_plot = go.Scatter(
        x=time_array,
        y=variable_array,
        name=series_name,
        mode='lines'
    )

    figure_data.append(series_plot)

    figure = {
        'data': figure_data,
        'layout': {
            'title': {
                'text': figure_title,
                'pad': {
                    'b': 5,
                },
            },
            'yaxis': {'title': yaxis_title},
            'legend': {
                'orientation': 'h'
            },
            'margin': {
                'l': 40,
                'r': 10,
                't': 80,
                'b': 10
            }
        }
    }

    return figure
Create a new controller,
get_time_series_plot, to handle plot requests. Add the following tocontrollers.py:
import geojson
from datetime import datetime
from simplejson.errors import JSONDecodeError
from tethys_sdk.gizmos import SelectInput, PlotlyView
from .figure import generate_figure
from .thredds_methods import parse_datasets, get_layers_for_wms, extract_time_series_at_location
@controller
def get_time_series_plot(request):
    context = {'success': False}

    if request.method != 'POST':
        return HttpResponseNotAllowed(['POST'])

    try:
        log.debug(f'POST: {request.POST}')

        geojson_str = str(request.POST.get('geometry', None))
        dataset = request.POST.get('dataset', None)
        variable = request.POST.get('variable', None)
        start_time = request.POST.get('start_time', None)
        end_time = request.POST.get('end_time', None)
        vertical_level = request.POST.get('vertical_level', None)

        # Deserialize GeoJSON string into Python objects
        try:
            geometry = geojson.loads(geojson_str)
        except JSONDecodeError:
            raise ValueError('Please draw an area of interest.')

        # Convert milliseconds from epoch to date time
        if start_time is not None:
            s = int(start_time) / 1000.0
            start_time = datetime.fromtimestamp(s)

        if end_time is not None:
            e = int(end_time) / 1000.0
            end_time = datetime.fromtimestamp(e)

        # Retrieve the connection to the THREDDS server
        catalog = App.get_spatial_dataset_service(App.THREDDS_SERVICE_NAME, as_engine=True)

        time_series = extract_time_series_at_location(
            catalog=catalog,
            geometry=geometry,
            dataset=dataset,
            variable=variable,
            start_time=start_time,
            end_time=end_time,
            vertical_level=vertical_level
        )

        log.debug(f'Time Series: {time_series}')

        figure = generate_figure(
            time_series=time_series,
            dataset=dataset,
            variable=variable
        )

        plot_view = PlotlyView(figure, height='200px', width='100%')

        context.update({
            'success': True,
            'plot_view': plot_view
        })

    except ValueError as e:
        context['error'] = str(e)

    except Exception:
        context['error'] = f'An unexpected error has occurred. Please try again.'
        log.exception('An unexpected error occurred.')

    return App.render(request, 'plot.html', context)
Create a new template for the
get_time_series_plotcontroller,templates/thredds_tutorial/plot.html, with the following contents:
{% load tethys %}

{% if plot_view %}
  {% gizmo plot_view %}
{% endif %}

{% if error %}
  <div class="alert alert-danger" role="alert">
    <span>{{ error }}</span>
  </div>
{% endif %}
4. Load Plot Using JQuery Load
The JQuery.load() method is used to call a URL and load the returned HTML into the target element. In this step, you'll use jQuery.load() to call the get-time-series-plot endpoint and load the markup for the plot that is returned into a modal for display to the user. This pattern allows you to render the plot dynamically with minimal JavaScript, because the plot is parameterized using Python on the server.
Download this
animated plot loading imageor find one that you like and save it to thepublic/imagesdirectory.Create a new stylesheet,
public/css/plot.css, with the following contents:
#plot-loader {
    margin: 65px 34px;
}

#plot-loader p {
    text-align: center;
}

#plot-modal .modal-body {
    min-height: 480px;
}
Include the Plotly gizmo dependencies and the new stylesheet in
templates/thredds_tutorial/home.html:
{% block import_gizmos %}
  {% import_gizmo_dependency plotly_view %}
{% endblock %}

{% block styles %}
  {{ block.super }}
  <link rel="stylesheet" href="https://unpkg.com/leaflet@1.8.0/dist/leaflet.css"
   integrity="sha512-hoalWLoI8r4UszCkZ5kL8vayOGVae1oxXe/2A4AO6J9+580uKHDO3JdHb7NzwwzK5xr/Fs0W40kiNHxM9vyTtQ=="
   crossorigin=""/>
  <link rel="stylesheet" href="https://cdn.jsdelivr.net/npm/leaflet-timedimension@1.1.1/dist/leaflet.timedimension.control.min.css" />
  <link rel="stylesheet" href="https://cdnjs.cloudflare.com/ajax/libs/leaflet.draw/0.4.2/leaflet.draw.css"/>
  <link rel="stylesheet" href="{% static tethys_app|public:'css/leaflet_map.css' %}"/>
  <link rel="stylesheet" href="{% static tethys_app|public:'css/loader.css' %}" />
  <link rel="stylesheet" href="{% static tethys_app|public:'css/plot.css' %}" />
{% endblock %}
Add a modal to
templates/thredds_tutorial/home.htmlfor displaying the plot:
{% block after_app_content %}
  <div id="loader">
    <img src="{% static tethys_app|public:'images/map-loader.gif' %}">
  </div>
  <!-- Plot Modal -->
  <div class="modal fade" id="plot-modal" tabindex="-1" role="dialog" aria-labelledby="plot-modal-label">
    <div class="modal-dialog" role="document">
      <div class="modal-content">
        <div class="modal-header">
          <h5 class="modal-title" id="plot-modal-label">Area of Interest Plot</h5>
          <button type="button" class="btn-close" data-bs-dismiss="modal" aria-label="Close"></button>
        </div>
        <div class="modal-body">
          <div id="plot-container"></div>
        </div>
      </div>
    </div>
  </div>
{% endblock %}
Note
The empty #plot-container div is the element that you will target with the jQuery.load() method and thus where the plot will be rendered.
Declare two new plot methods in the PRIVATE FUNCTION DECLARATIONS section of
public/js/leafet_map.js:
// Plot Methods
var init_plot_at_location, show_plot_modal, update_plot;
The
show_plot_modalwill reset the modal with the loading gif and show the modal if it is not already showing. Add theshow_plot_modalmethod after theinit_plot_at_locationmethod inpublic/js/leaflet_map.js:
show_plot_modal = function() {
    // Replace last plot with animated loading image
    $('#plot-container').html(
        '<div id="plot-loader">' +
            '<img src="/static/thredds_tutorial/images/plot-loader.gif">' +
            '<p>Loading... Please wait.</p>' +
        '</div>'
    );

    // Show the modal
    $('#plot-modal').modal('show');
};
The
update_plotmethod will gather the needed parameters for theget-time-series-plotendpoint and call it withjQuery.load(). Add theupdate_plotmethod after theshow_plot_modalmethod inpublic/js/leaflet_map.js:
update_plot = function(location_layer) {
    // Reset and show plot modal
    show_plot_modal();

    // Serialize geometry for request
    let geometry = location_layer.toGeoJSON();
    let geometry_str = JSON.stringify(geometry);

    // Build data packet
    let data = {
        geometry: geometry_str,
        variable: m_curr_variable,
        dataset: m_curr_dataset,
    };

    // Get available time range from time control on map (if any)
    let available_times = m_map.timeDimension.getAvailableTimes()
    if (available_times && available_times.length) {
        data.start_time = available_times[0]
        data.end_time = available_times[available_times.length - 1]
    }

    // Get vertical level
    let vertical_level = $('#vertical_level').val();
    if (vertical_level) {
        data.vertical_level = vertical_level;
    }

    // Call load
    $('#plot-container').load('get-time-series-plot/', data);
};
Note
$ is an alias or shorthand for jQuery.
When
jQuery.load()is called with the data parameter, as it is in this case, the request is submitted using thePOSTmethod. You must include the CSRF token with any POST request for Django to accept the request. Add the following topublic/js/main.jsto allowjQuery.load()to use thePOSTmethod:
// Get a cookie
function getCookie(name) {
    var cookieValue = null;
    if (document.cookie && document.cookie != '') {
        var cookies = document.cookie.split(';');
        for (var i = 0; i < cookies.length; i++) {
            var cookie = jQuery.trim(cookies[i]);
            // Does this cookie string begin with the name we want?
            if (cookie.substring(0, name.length + 1) == (name + '=')) {
                cookieValue = decodeURIComponent(cookie.substring(name.length + 1));
                break;
            }
        }
    }
    return cookieValue;
}

// find if method is csrf safe
function csrfSafeMethod(method) {
    // these HTTP methods do not require CSRF protection
    return (/^(GET|HEAD|OPTIONS|TRACE)$/.test(method));
}

// add csrf token to appropriate ajax requests
$(function() {
    $.ajaxSetup({
        beforeSend: function(xhr, settings) {
            if (!csrfSafeMethod(settings.type) && !this.crossDomain) {
                xhr.setRequestHeader("X-CSRFToken", getCookie("csrftoken"));
            }
        }
    });
}); //document ready;
Replace the
init_plot_at_locationmethod inpublic/js/leaflet_map.jswith the following new implementation that callsupdate_plotin the on-draw handler:
init_plot_at_location = function() {
    // Initialize layer for drawn features
    m_drawn_features = new L.FeatureGroup();
    m_map.addLayer(m_drawn_features);

    // Initialize draw controls
    let draw_control = new L.Control.Draw({
        draw: {
            polyline: false,
            polygon: false,
            circle: false,
            rectangle: false,
        }
    });

    m_map.addControl(draw_control);

    // Bind to draw event
    m_map.on(L.Draw.Event.CREATED, function(e) {
        // Remove all layers (only show one location at a time)
        m_drawn_features.clearLayers();

        // Add layer with the new features
        let new_features_layer = e.layer;
        m_drawn_features.addLayer(new_features_layer);

        // Load the plot
        update_plot(new_features_layer);
    });
};
Clear any drawn features whenever the layer is changed. Replace the
update_layermethod inpublic/js/leaflet_map.jswith the following updated implementation:
update_layer = function() {
    if (m_td_layer) {
        m_map.removeLayer(m_td_layer);
    }

    // Clear the legend
    clear_legend();

    // Clear drawn features
    if (m_drawn_features) {
        m_drawn_features.clearLayers();
    }

    var proxyWMSURL = `getWMSImageFromServer?main_url=${encodeURIComponent(m_curr_wms_url)}`;

    // Layer
    m_layer = L.tileLayer.wms(proxyWMSURL, {
        layers: m_curr_variable,
        format: 'image/png',
        transparent: true,
        colorscalerange: '250,350',  // Hard-coded color scale range won't work for all layers
        abovemaxcolor: "extend",
        belowmincolor: "extend",
        numcolorbands: 100,
        styles: m_curr_style
    });

    // Wrap WMS layer in Time Dimension Layer
    m_td_layer = L.timeDimension.layer.wms(m_layer, {
        updateTimeDimension: true
    });

    // Add events for loading
    m_layer.on('loading', function() {
        show_loader();
    });

    m_layer.on('load', function() {
        hide_loader();
    });

    // Add Time-Dimension-Wrapped WMS layer to the Map
    m_td_layer.addTo(m_map);

    // Update the legend graphic
    update_legend();
};
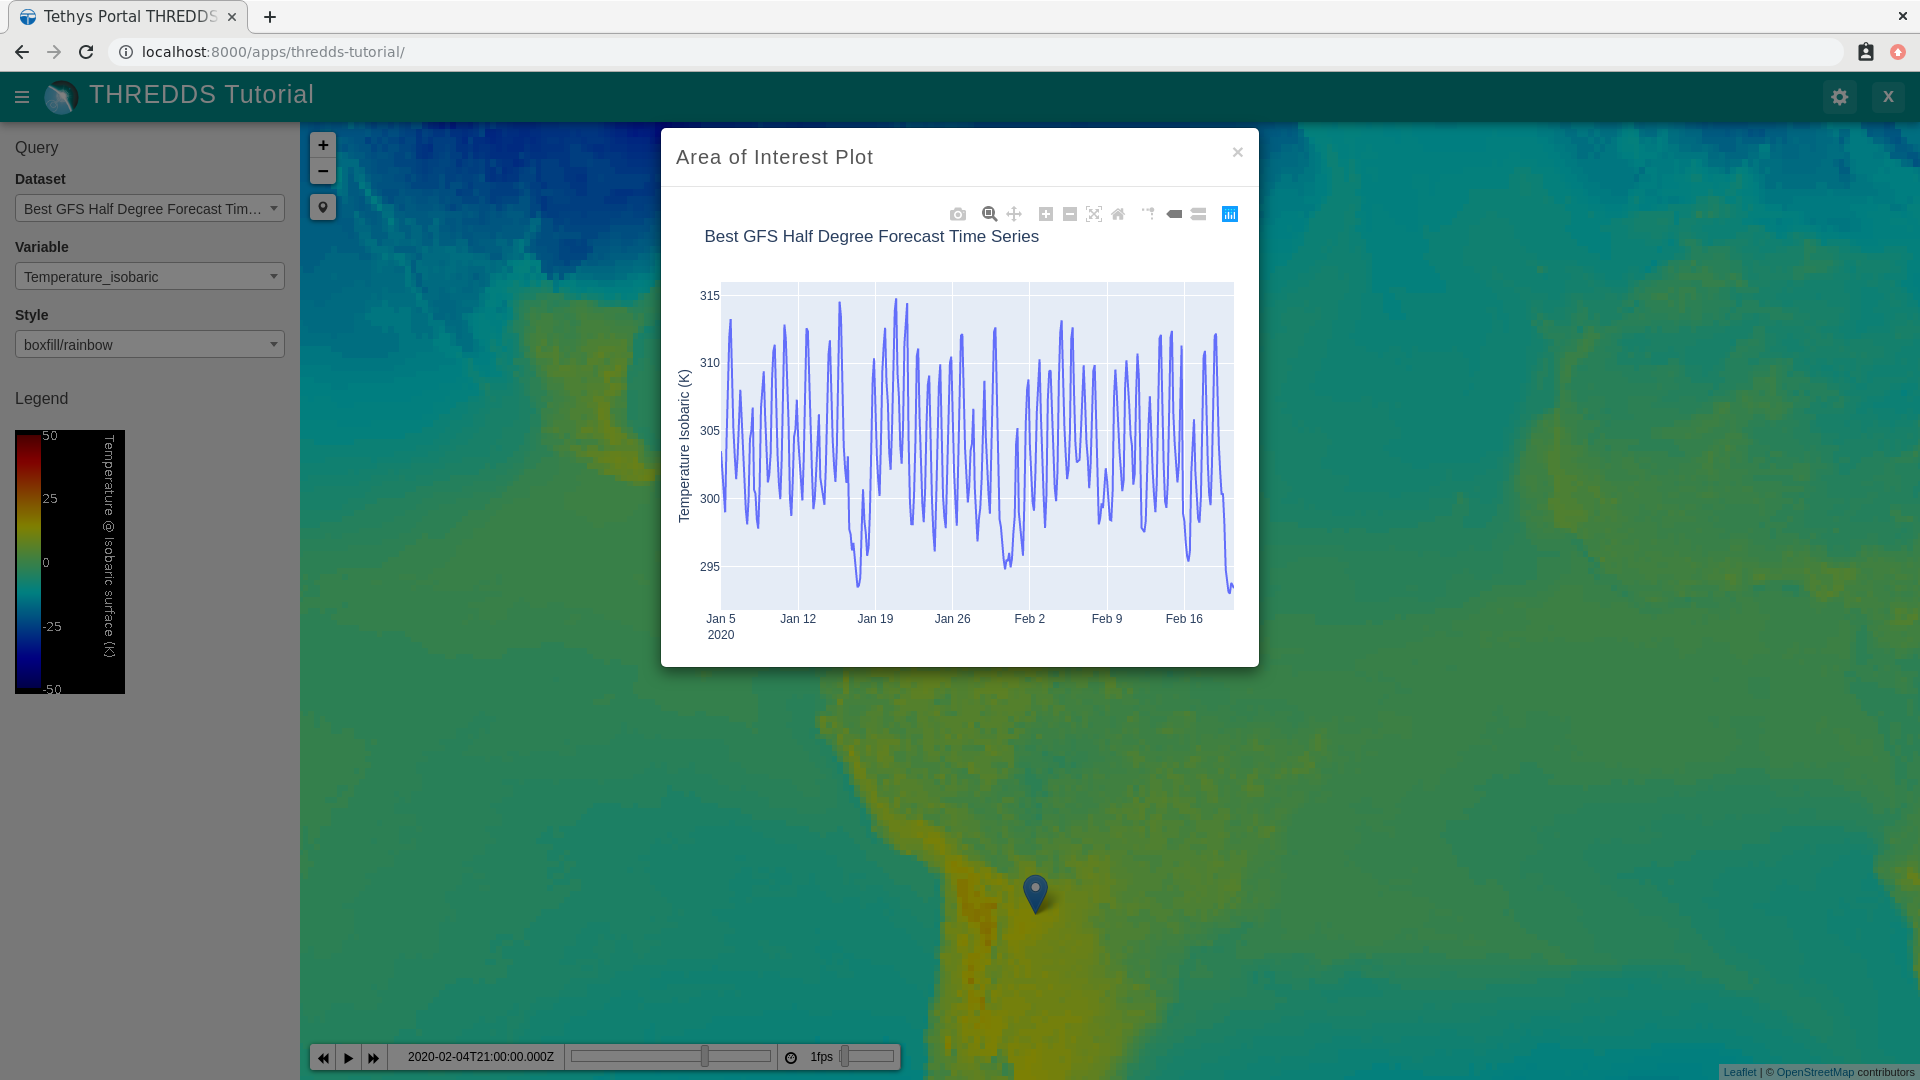
5. Test and Verify
Browse to http://localhost:8000/apps/thredds-tutorial in a web browser and login if necessary. Verify the following:
Select the "Best GFS Half Degree Forecast Time Series" dataset using the Dataset control to test a time-varying layer.
Click on the Draw a Marker button, located just below the zoom controls on the map.
Drop a marker somewhere on the map.
Verify that the plot dialog appears automatically after dropping the marker with the loading image showing.
Verify that the plot appears after the data has been queried.
6. Solution
This concludes the New App Project portion of the THREDDS Tutorial. You can view the solution on GitHub at https://github.com/tethysplatform/tethysapp-thredds_tutorial/tree/thredds-service-solution-3.0 or clone it as follows:
git clone https://github.com/tethysplatform/tethysapp-thredds_tutorial
cd tethysapp-thredds_tutorial
git checkout -b plot-at-location-solution plot-at-location-solution-4.5