Map Layout
Last Updated: May 2023
The MapLayout provides a drop-in full-screen map view for Tethys Apps. Displaying a map with a few layers can be accomplished in tens of lines of code and implementing more advanced functionality can be accomplished in hundreds. It includes a layer tree with visibility controls and actions such as "Zoom to Layer". The view can also includes many optional features such as displaying legends for layers, feature selection, map annotation / drawing tools, location lookup via geocoding, and a click-and-plot feature.

Setup
Setting up a new MapLayout involves the following steps:
Create a new class in
controllers.pythat inherits fromMapLayout.Decorate the new class with the Controller Decorator to set up routing.
Configure the new
MapLayoutby setting properties on the new class. Review the MapLayout properties for a full list. For example, set themap_titleproperty to set the title of the view that appears in the navigation bar.
Tip
Checkout the Map Layout Tutorial for step-by-step instructions for using the MapLayout.
The following example demonstrates how to create a new MapLayout view:
from django.urls import reverse_lazy
from tethys_sdk.layouts import MapLayout
from tethys_sdk.routing import controller


@controller(
    name="map",
    url="my_first-app/map"
)
class MyMapLayout(MapLayout):
    app = app
    base_template = 'my_first_app/base.html'
    back_url = reverse_lazy('my_first_app:home')
    map_title = 'My Map Layout'
    map_subtitle = 'Subtitle'
    basemaps = [
        'OpenStreetMap',
        'ESRI'
    ]
    default_map_extent = [-65.69, 23.81, -129.17, 49.38]  # CONUS bbox
    max_zoom = 16
    min_zoom = 2
Add Layers
To add layers to the map in a MapLayout, override the compose_layers method. The MapLayout view uses the MapView Gizmo under the covers and it is given to the compose_layers() method via the map_view argument. Use the map_view argument to add new MVLayers to the MapView.
While the MapView Gizmo will be able to accept any MVLayer object, the MapLayout needs layers to have additional metadata attached for them to be recognized by the layers in the Layer Tree, legend, and other features of MapLayout. Several helper methods are provided by MapLayout to assist with building MVLayer objects in the correct way: build_wms_layer(), build_geojson_layer(), and build_arc_gis_layer().
In addition, the compose_layers() method needs to return a list of at least one Layer Group. A Layer Group contains a list of layers and is used by the Layer Tree of MapLayout to organize layers. In addition, a control type is specified for each Layer Group ('check' or 'radio'), and can be used to control whether all the layers in a Layer Group can be viewed simultaneously ('check') or only one at a time ('radio'). Create Layer Groups using the build_layer_group helper method.
WMS Layer
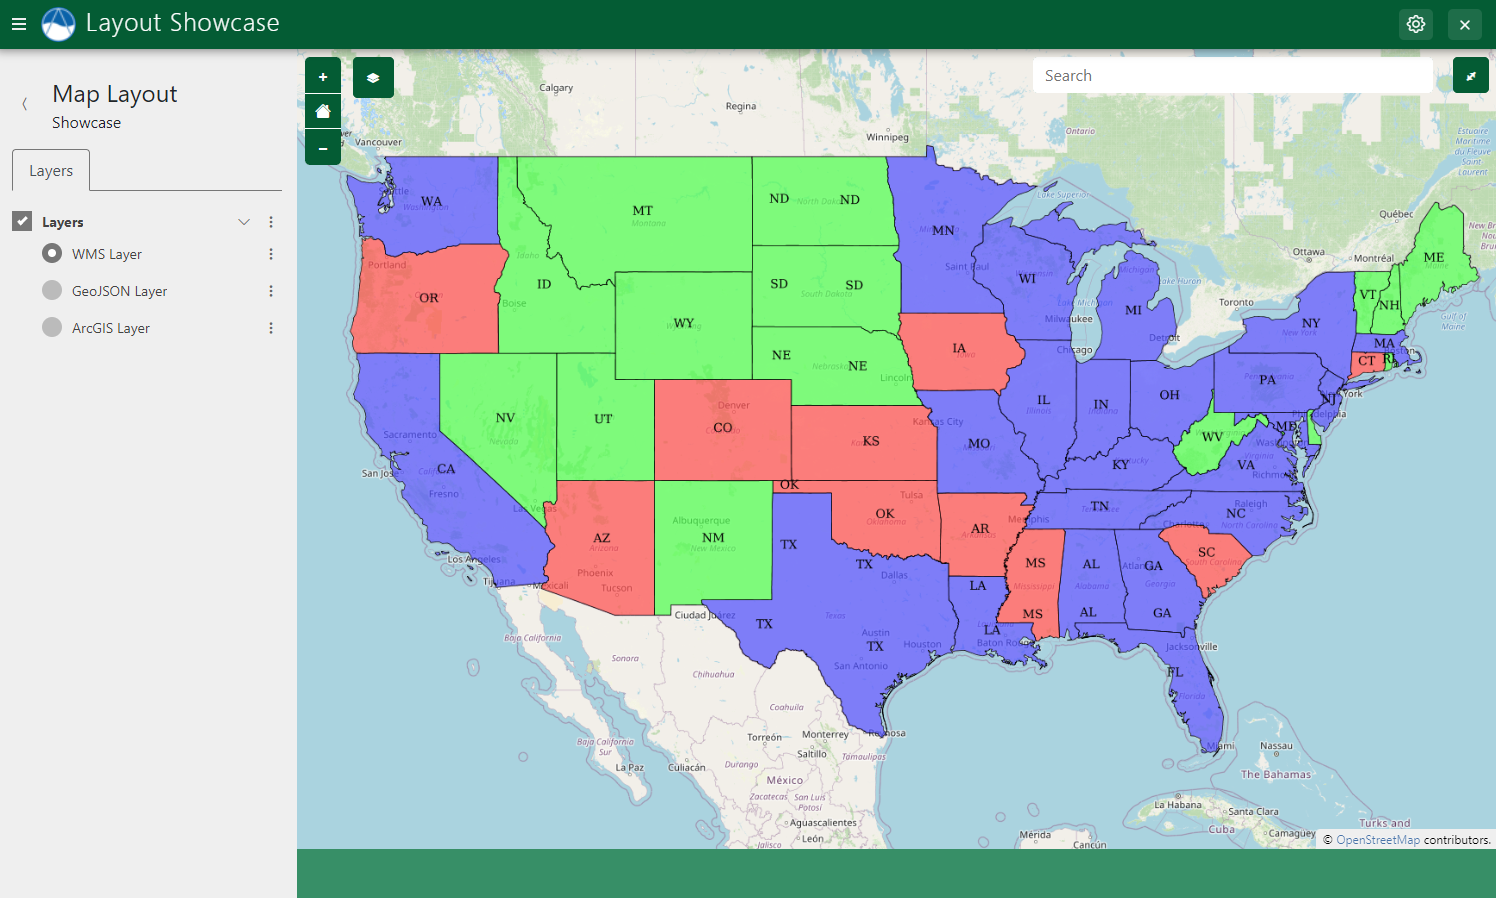
The following example demonstrates how to add WMS layers to a MapLayout using the build_wms_layer method:
@controller(
    name="map",
    url="my_first-app/map"
)
class MyMapLayout(MapLayout):

    ...

    def compose_layers(self, request, map_view, *args, **kwargs):
        """
        Add layers to the MapLayout and create associated layer group objects.
        """
        # WMS Layer
        usa_population = self.build_wms_layer(
            endpoint='http://localhost:8181/geoserver/wms',
            server_type='geoserver',
            layer_name='topp:states',
            layer_title='USA Population',
            layer_variable='population',
            visible=True,  # Set to False if the layer should be hidden initially
        )

        # Add layer to map
        map_view.layers.append(usa_population)

        # Add layer to layer group
        layer_groups = [
            self.build_layer_group(
                id='usa-layer-group',
                display_name='United States',
                layer_control='radio',  # 'radio' or 'check'
                layers=[
                    usa_population,
                ],
            ),
        ]

        return layer_groups
Caution
The ellipsis (...) in code examples indicate code that is not shown for brevity. DO NOT COPY VERBATIM.
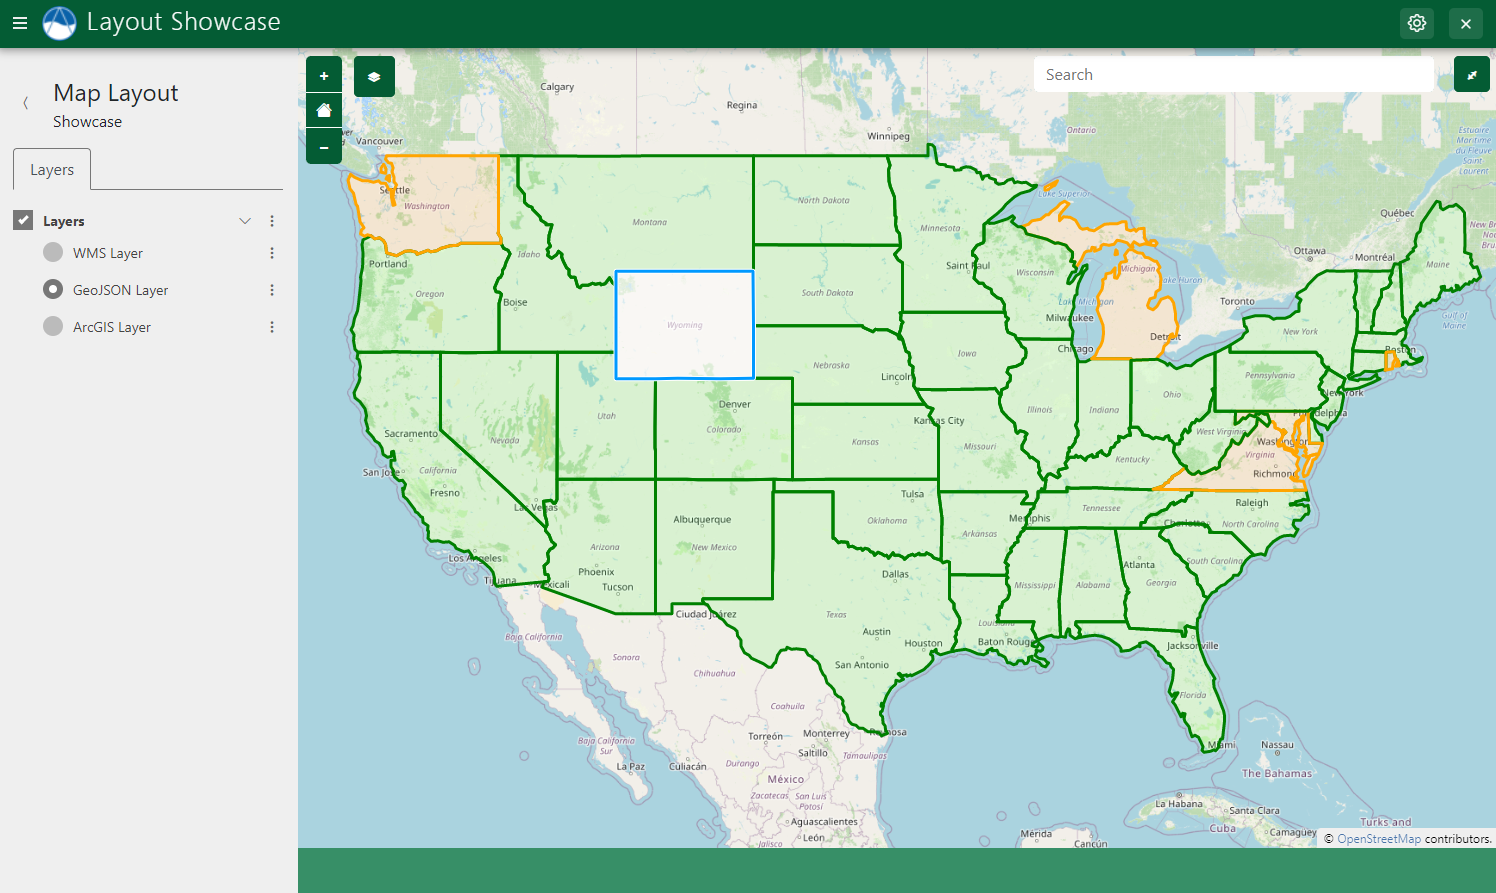
GeoJSON Layers
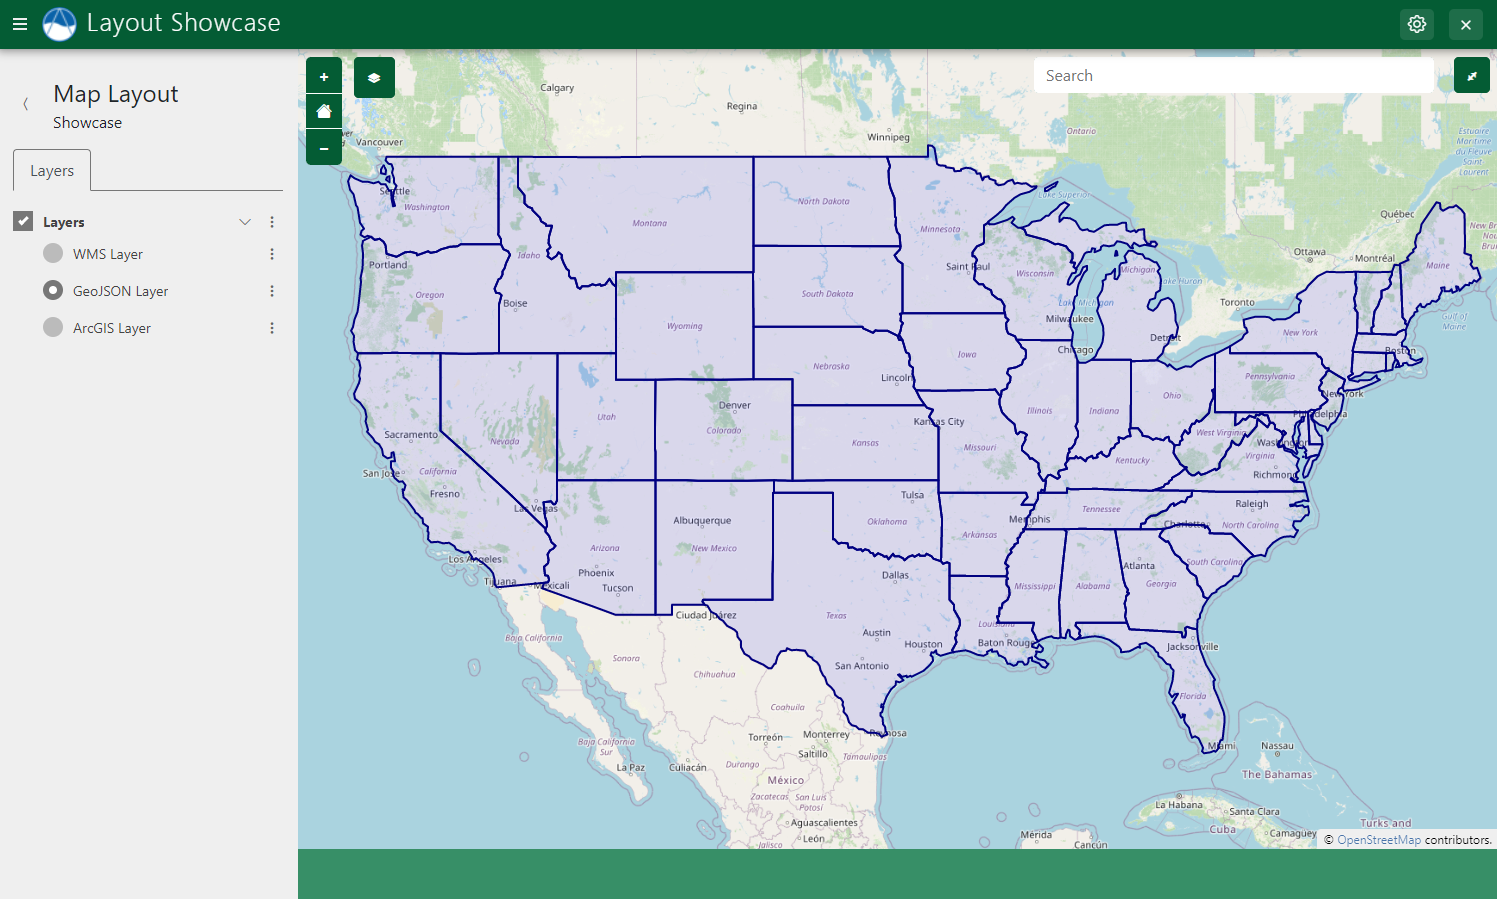
Figure 3: Example of a GeoJSON layer displayed in a Map Layout.
The following example demonstrates how to add a GeoJSON layer to a MapLayout using the build_geojson_layer method:
@controller(
    name="map",
    url="my_first-app/map"
)
class MyMapLayout(MapLayout):

    ...

    def compose_layers(self, request, map_view, *args, **kwargs):
        """
        Add layers to the MapLayout and create associated layer group objects.
        """
        # Load GeoJSON From File
        us_states_path = Path(app_workspace.path) / 'my_first_app' / 'us-states.json'
        with open(us_states_path) as gj:
            us_states_geojson = json.loads(gj.read())

        # GeoJSON Layer
        us_states_layer = self.build_geojson_layer(
            geojson=us_states_geojson,
            layer_name='us-states',
            layer_title='U.S. States',
            layer_variable='reference',
            visible=True,
        )

        # Add layer to map
        map_view.layers.append(us_states_layer)

        # Add layer to layer group
        ...
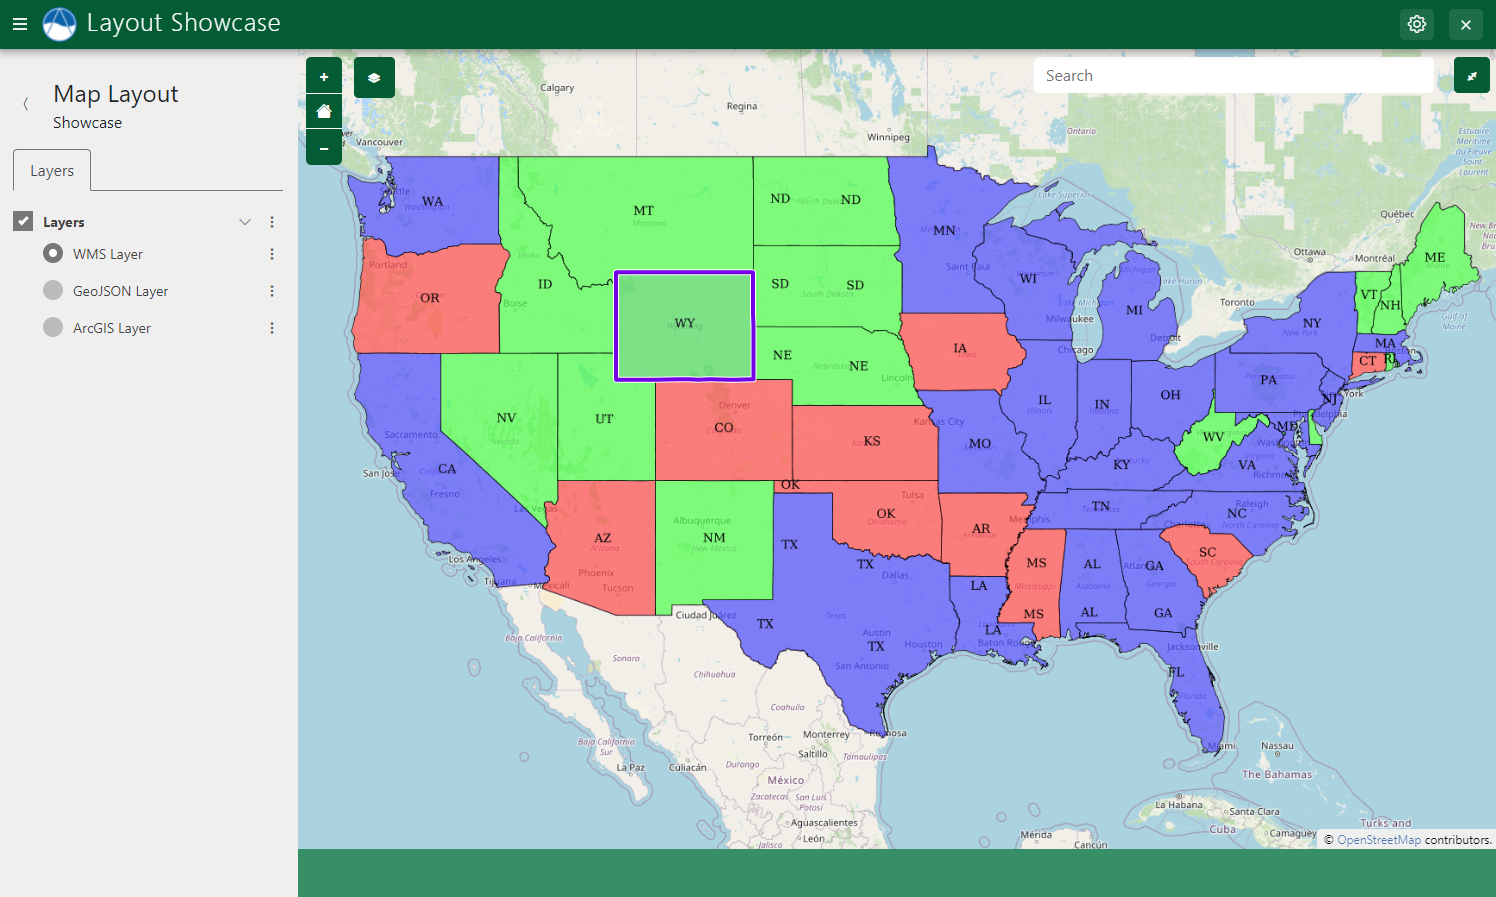
Vector Layer Styles
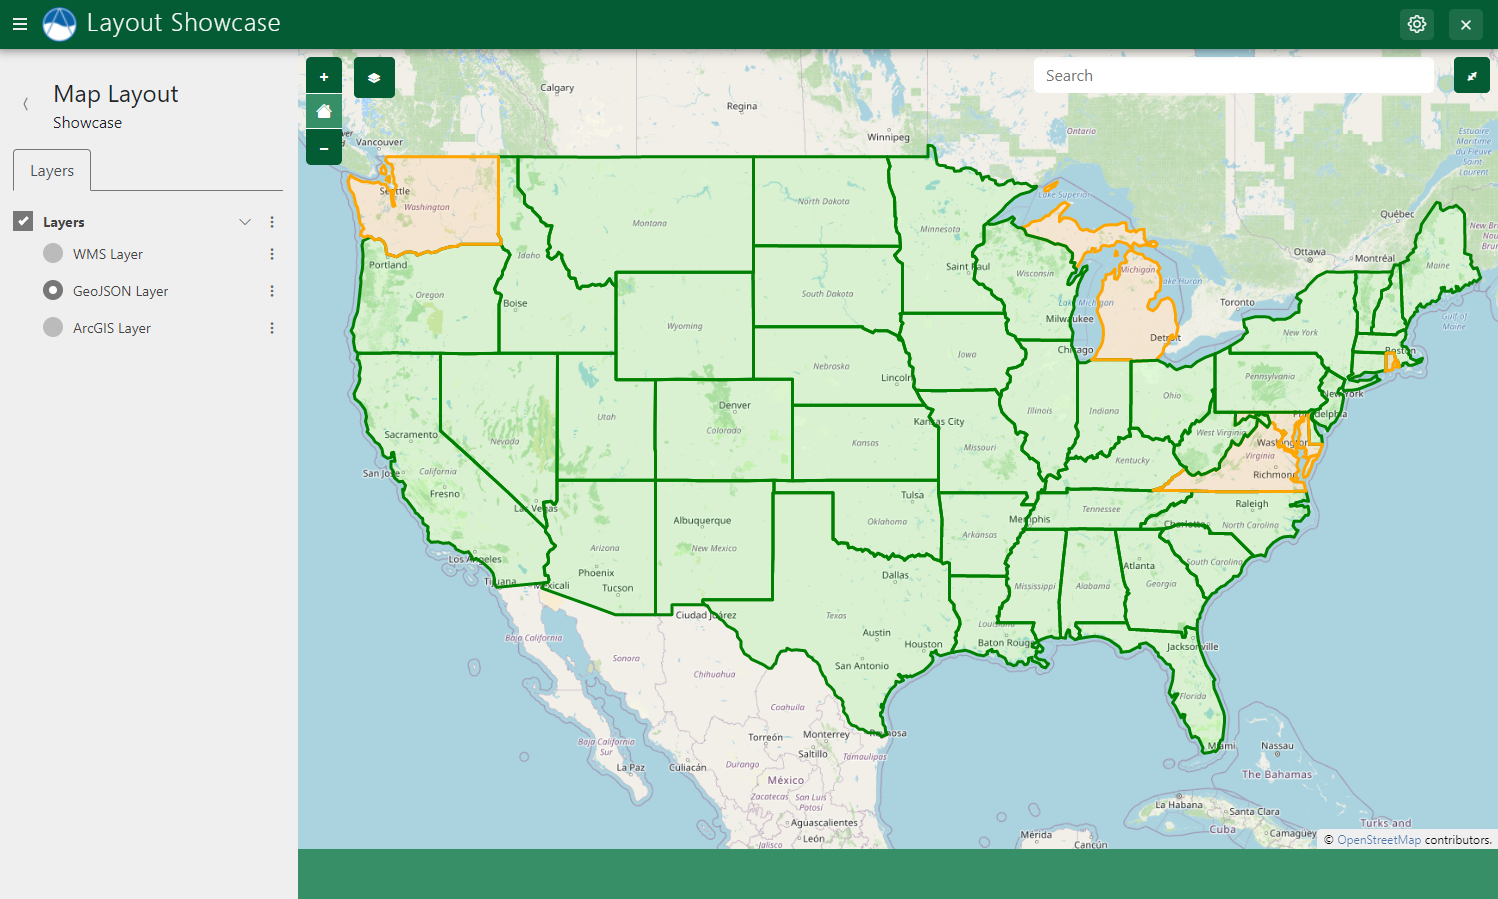
Figure 4: Example of a GeoJSON layer with custom styles displayed in a Map Layout.
Use the get_vector_style_map method of MapLayout to define custom styles for GeoJSON layers. The method expects a dictionary to be returned containing keys that coorespond to feature types (e.g.: "Point", "LineString", "Polygon") and values that are the style definition. The style definitions are created using a Python dictionary syntax that mirrors the OpenLayers Style API. The For example:
@controller(
    name="map",
    url="my_first-app/map"
)
class MyMapLayout(MapLayout):

    ...
    @classmethod
    def get_vector_style_map(cls):
        return {
            'Point': {'ol.style.Style': {
                'image': {'ol.style.Circle': {
                    'radius': 5,
                    'fill': {'ol.style.Fill': {
                        'color': 'red',
                    }},
                    'stroke': {'ol.style.Stroke': {
                        'color': 'red',
                        'width': 2
                    }}
                }}
            }},
            'LineString': {'ol.style.Style': {
                'stroke': {'ol.style.Stroke': {
                    'color': 'green',
                    'width': 3
                }}
            }},
            'MultiPolygon': {'ol.style.Style': {
                'stroke': {'ol.style.Stroke': {
                    'color': 'orange',
                    'width': 3
                }},
                'fill': {'ol.style.Fill': {
                    'color': 'rgba(255, 140, 0, 0.1)'
                }}
            }},
            'Polygon': {'ol.style.Style': {
                'stroke': {'ol.style.Stroke': {
                    'color': 'green',
                    'width': 3
                }},
                'fill': {'ol.style.Fill': {
                    'color': 'rgba(0, 255, 0, 0.1)'
                }}
            }},
        }
ArcGIS REST Layer
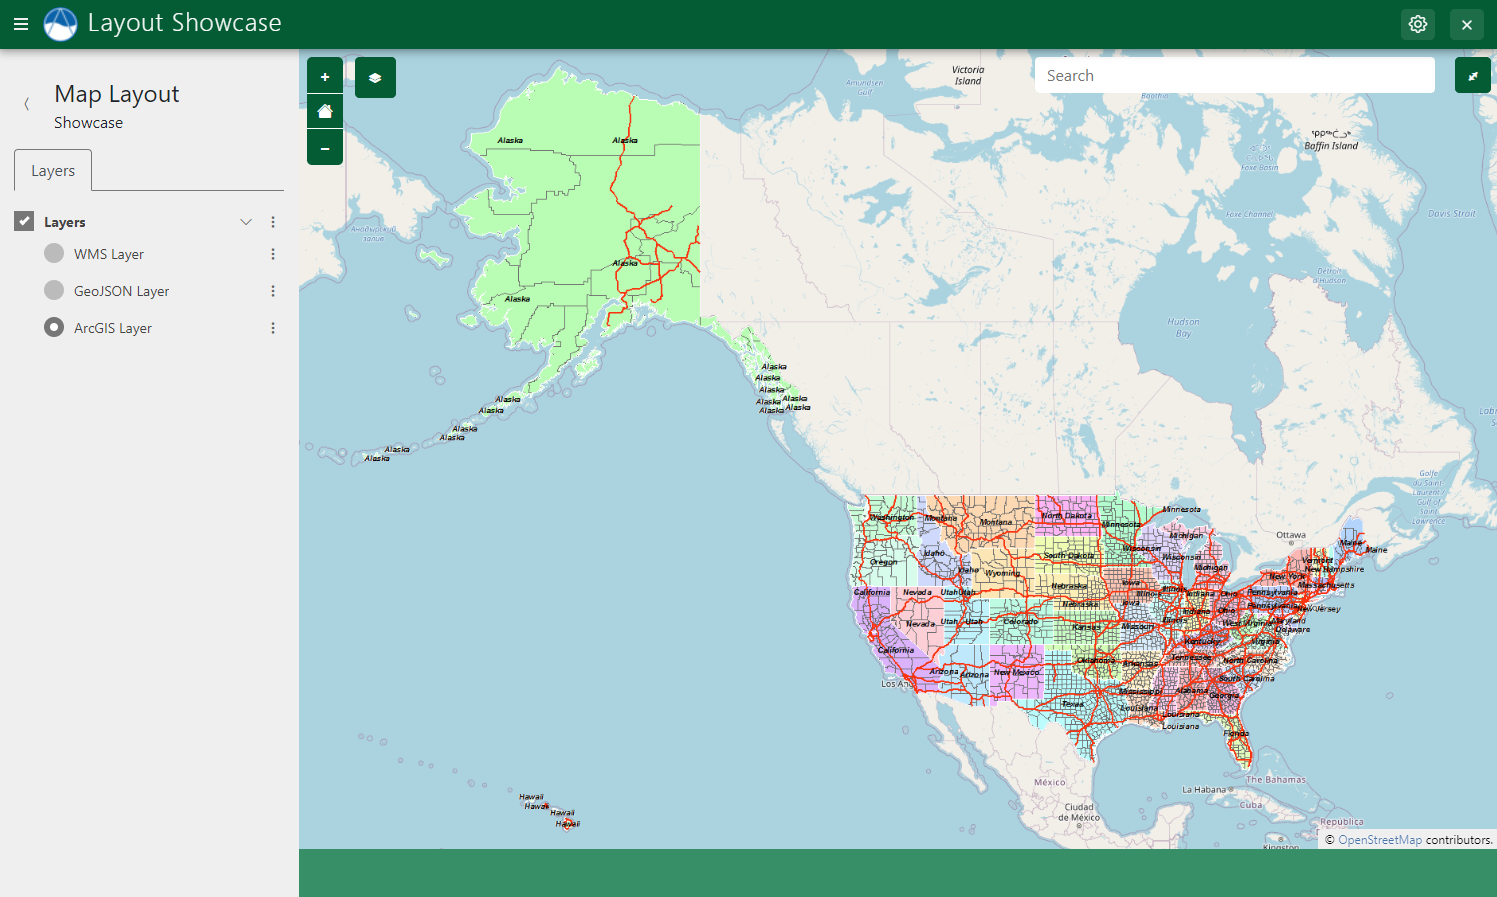
Figure 5: Example of a ArcGIS layer displayed in a Map Layout.
The following example demonstrates how to add an ArcGIS REST layer to a MapLayout using the build_arc_gis_layer method:
@controller(
    name="map",
    url="my_first-app/map"
)
class MyMapLayout(MapLayout):

    ...

    def compose_layers(self, request, map_view, *args, **kwargs):
        """
        Add layers to the MapLayout and create associated layer group objects.
        """
        # ArcGIS Layer
        precip_layer = self.build_arc_gis_layer(
            endpoint='https://mapservices.weather.noaa.gov/raster/rest/services/obs/rfc_qpe/MapServer',
            layer_name='25',  # ArcGIS MapServer Layer ID
            layer_title='RFC QPE Last 24 Hours (inches)',
            layer_variable='precipitation',
            visible=False,
            extent=[-65.69, 23.81, -129.17, 49.38],  # CONUS bbox
        )

        # Add layer to map
        map_view.layers.append(precip_layer)

        # Add layer to layer group
        ...
Feature Selection
The MapLayout layout supports two modes of feature selection: Feature Selection for Vector Layers and Feature Selection for WMS Layers. Select features by clicking on the feature and select multiple layers by holding the SHIFT key while clicking on features.
Vector Layers
Vector layers, like GeoJSON layers, support Feature selection.
Feature Selection for Vector Layers, such as GeoJSON layers, can be enabled on a layer-by-layer basis by setting the selectable argument to True:
# Load GeoJSON From File
us_states_path = Path(app_workspace.path) / 'my_first_app' / 'us-states.json'
with open(us_states_path) as gj:
    us_states_geojson = json.loads(gj.read())

# GeoJSON Layer
us_states_layer = self.build_geojson_layer(
    geojson=us_states_geojson,
    layer_name='us-states',
    layer_title='U.S. States',
    layer_variable='reference',
    visible=True,
    selectable=True
)
Note
Clicking inside a polygon feature will not select it. Instead, click on the border of the polygon to select it.
JavaScript
Use the getSelectInteraction() method of the underlying MapView Gizmo to bind functions to the Vector feature selection event:
$(function() { // Wait for page to load
    let selection_interaction = TETHYS_MAP_VIEW.getSelectInteraction();

    // Called each time the select interaction's list of features changes
    selection_interaction.getFeatures().on('change:length', function(e) {
        // Check if there is at least 1 feature selected
        if (e.target.getLength() > 0) {
            // Do something with the feature
            let selected_feature = e.target.item(0); // 1st feature in Collection
            console.log(`Selected State: ${selected_feature.get('name')}`);
        }
    });
});
Tip
See the Custom Template and JavaScript section for how to define a custom template for a MapLayout and add custom JavaScript.
WMS Layers
MapLayout also supports feature selection for WMS layers that are hosted by a GeoServer and are derived from a vector source (e.g. created from a Shapefile or SQLView).
Enabling feature selection is done on a layer by layer basis by setting the selectable argument to True as shown in the example below:
# WMS Layer
usa_population = self.build_wms_layer(
    endpoint='http://localhost:8181/geoserver/wms',
    server_type='geoserver',
    layer_name='topp:states',
    layer_title='USA Population',
    layer_variable='population',
    visible=True,  # Set to False if the layer should be hidden initially
    selectable=True
)
Geometry attribute
The build_wms_layer method takes an additional feature-selection related argument that is sometimes necessary: geometry attribute. Use this argument to specify a different value if the partiuclar layer uses a different naming convention for the feature attribute that stores the geometry. The default value for geometry_attribute is "the_geom". For example:
# WMS Layer
usa_population = self.build_wms_layer(
    endpoint='http://localhost:8181/geoserver/wms',
    server_type='geoserver',
    layer_name='topp:states',
    layer_title='USA Population',
    layer_variable='population',
    visible=True,  # Set to False if the layer should be hidden initially
    selectable=True,
    geometry_attribute='geometry',  # Defaults to "the_geom"
)
Class Properties
There are two class properties that can be used to modify the behavior of the WMS feature selection: feature_selection_multiselect and feature_selection_sensitivity.
Set feature_selection_multiselect to True to allow selecting multiple features from WMS layers that have feature selection enabled. This is done by holding the SHIFT key while selecting. The default behavior is to allow only one feature to be selected at a time.
set the feature_selection_sensitivty to adjust the relative search radius around the clicked point of the selection algorithm. The default value is 4.
class MyMapLayout(MapLayout):
    feature_selection_multiselect = True
    feature_selection_sensitivty = 8
Property Popups
As the name suggestions, properties popups can be enabled to display properties of selected features in a popup dialog.
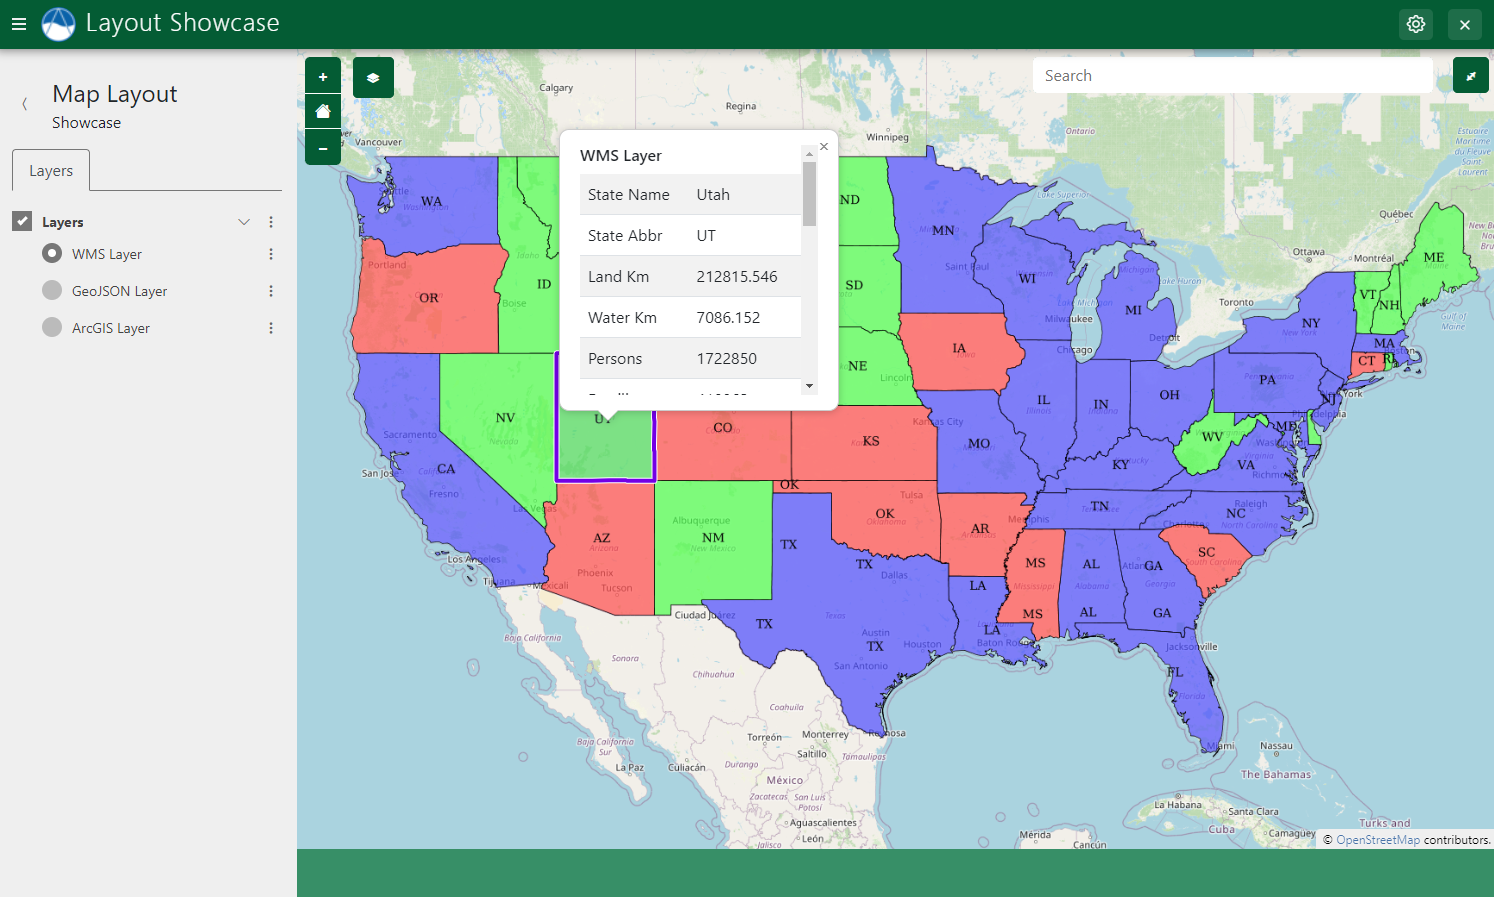
Figure 8: Example of properties popup on a selected feature from a WMS layer.
Enable pop-ups displaying the properties of selected features by setting the show_properties_popup to True.
class MyMapLayout(MapLayout):
    show_properties_popup = True
Note
This feature only works for the layer types supported by Feature Selection.
Exclude properties from being displayed in the properties pop-ups using the excluded_properties argument of the build methods. The id, type, geometry, the_geom, and layer_name properties are automatically excluded.
# WMS Layer
usa_population = self.build_wms_layer(
    endpoint='http://localhost:8181/geoserver/wms',
    server_type='geoserver',
    layer_name='topp:states',
    layer_title='USA Population',
    layer_variable='population',
    visible=True,  # Set to False if the layer should be hidden initially
    selectable=True,
    geometry_attribute='geometry',  # Defaults to "the_geom"
    excluded_properties=['STATE_FIPS', 'SUB_REGION'],
)
Note
Names of properties displayed in pop-ups have been reformatted by replacing any underscores (_) or hyphens (-) with spaces and changing the case to title case. For example, a property called STATE_FIPS would be displayed as State Fips. You must specify the pre-formatted/original version of the property name for the excluded_properties argument.
Caution
The Feature Selection Property Popup feature and the Map Clicks Popups feature cannot not be used together. When both are enabled, neither popup is displayed.
JavaScript
The MapLayout JavaScript API provides several methods for controlling the properties popup. See: show_properties_popup, close_properties_popup, hide_properties_popup, reset_properties_popup, properties_table_generator, custom_properties_generator, and custom_properties_initializer.
Tip
See the Custom Template and JavaScript section for how to define a custom template for a MapLayout and add custom JavaScript.
Map Clicks
The Map Clicks feature of MapLayout will display a point at the location on the map where the user clicked.
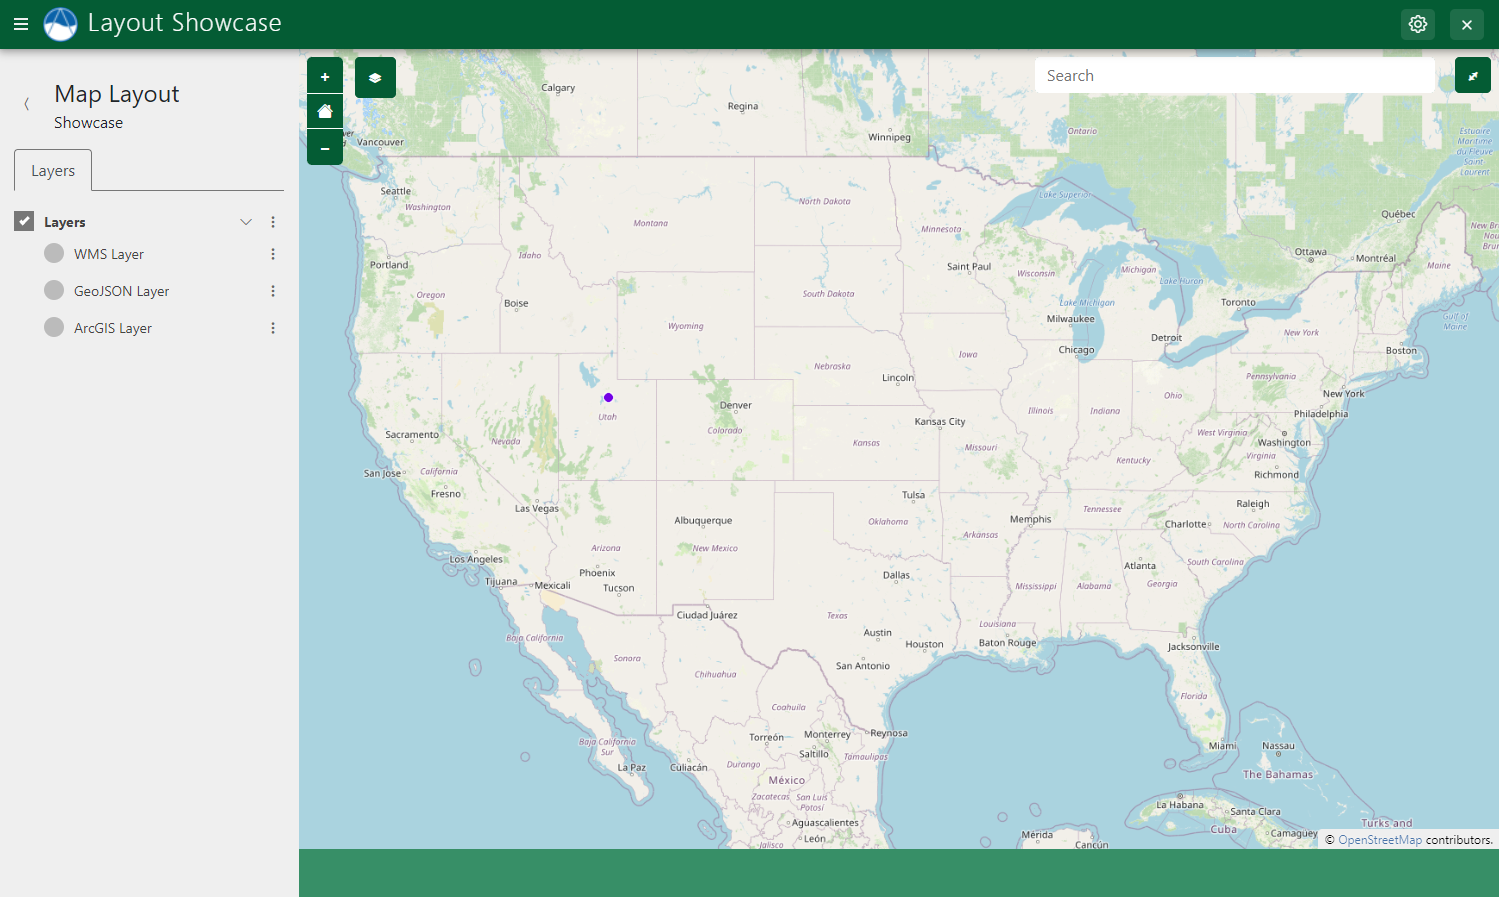
Figure 9: Map clicks adds a point on the map at the location where the user last clicked on the map.
Enable Map Clicks by setting the show_map_clicks property of MapLayout to True:
class MyMapLayout(MapLayout):
    show_map_clicks = True
Map Clicks Popups
The Map Clicks Popups feature displays a popup pointing to the point at the location on the map where the user clicked. The popup is empty by default, but content can be added using JavaScript and the selector #properties-popup-content (see JavaScript section below).
class MyMapLayout(MapLayout):
    show_map_clicks = True
    show_map_click_popup = True
Caution
The Map Clicks Popup feature and the Feature Selection Property Popups feature cannot not be used together. When both are enabled, neither popup is displayed.
JavaScript
Use the TETHYS_MAP_VIEW.mapClicked() method to respond to Map Click events. Pass a callback function that takes the coordinates of the clicked point as an argument:
$(function() {  // Wait for page to load
    // Map Click Event Handler
    TETHYS_MAP_VIEW.mapClicked(function(coords) {
        let popup_content = document.querySelector("#properties-popup-content");
        let lat_lon = ol.proj.transform(coords, 'EPSG:3857', 'EPSG:4326');
        let rounded_lat = Math.round(lat_lon[1] * 1000000) / 1000000;
        let rounded_lon = Math.round(lat_lon[0] * 1000000) / 1000000;
        popup_content.innerHTML = `<b>Coordinates:</b><p>${rounded_lat}, ${rounded_lon}</p>`;
    });
});
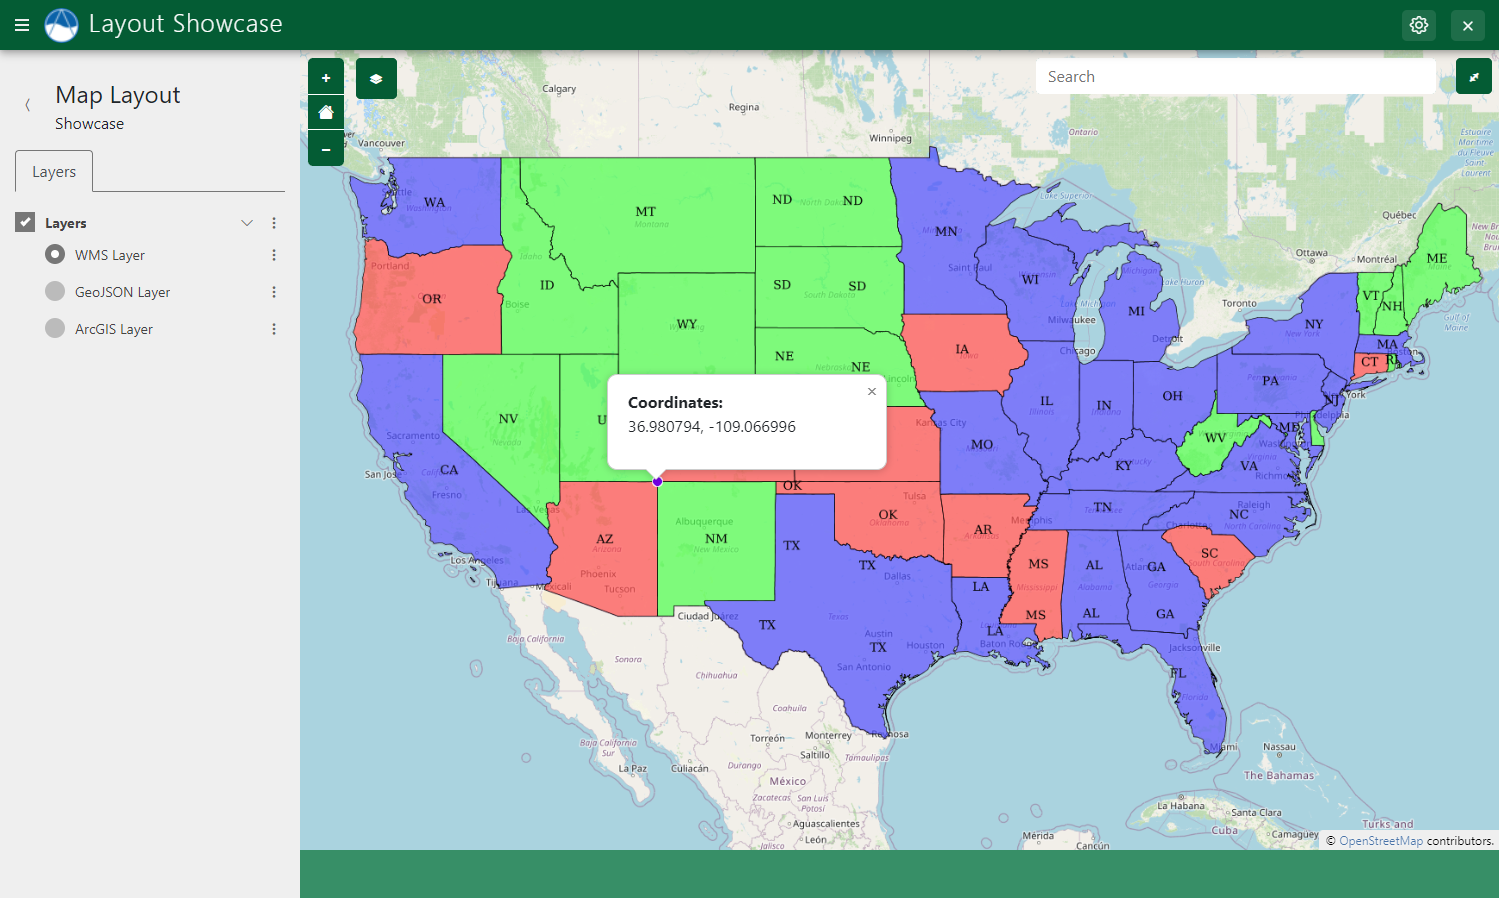
Figure 10: Example of custom content generated from JavaScript in the Map Click popup.
The show_properties_popup, close_properties_popup, hide_properties_popup, and reset_properties_popup methods can be used to manipulate the Map Click popup (see: Feature Selection > JavaScript).
Tip
See the Custom Template and JavaScript section for how to define a custom template for a MapLayout and add custom JavaScript.
Click and Plot
The Click and Plot capability of MapLayout can be used to plot data associated with individual features of a layer. The plots are powered by PlotlyJS and are displayed on a slide sheet that slides from the bottom of the map window.
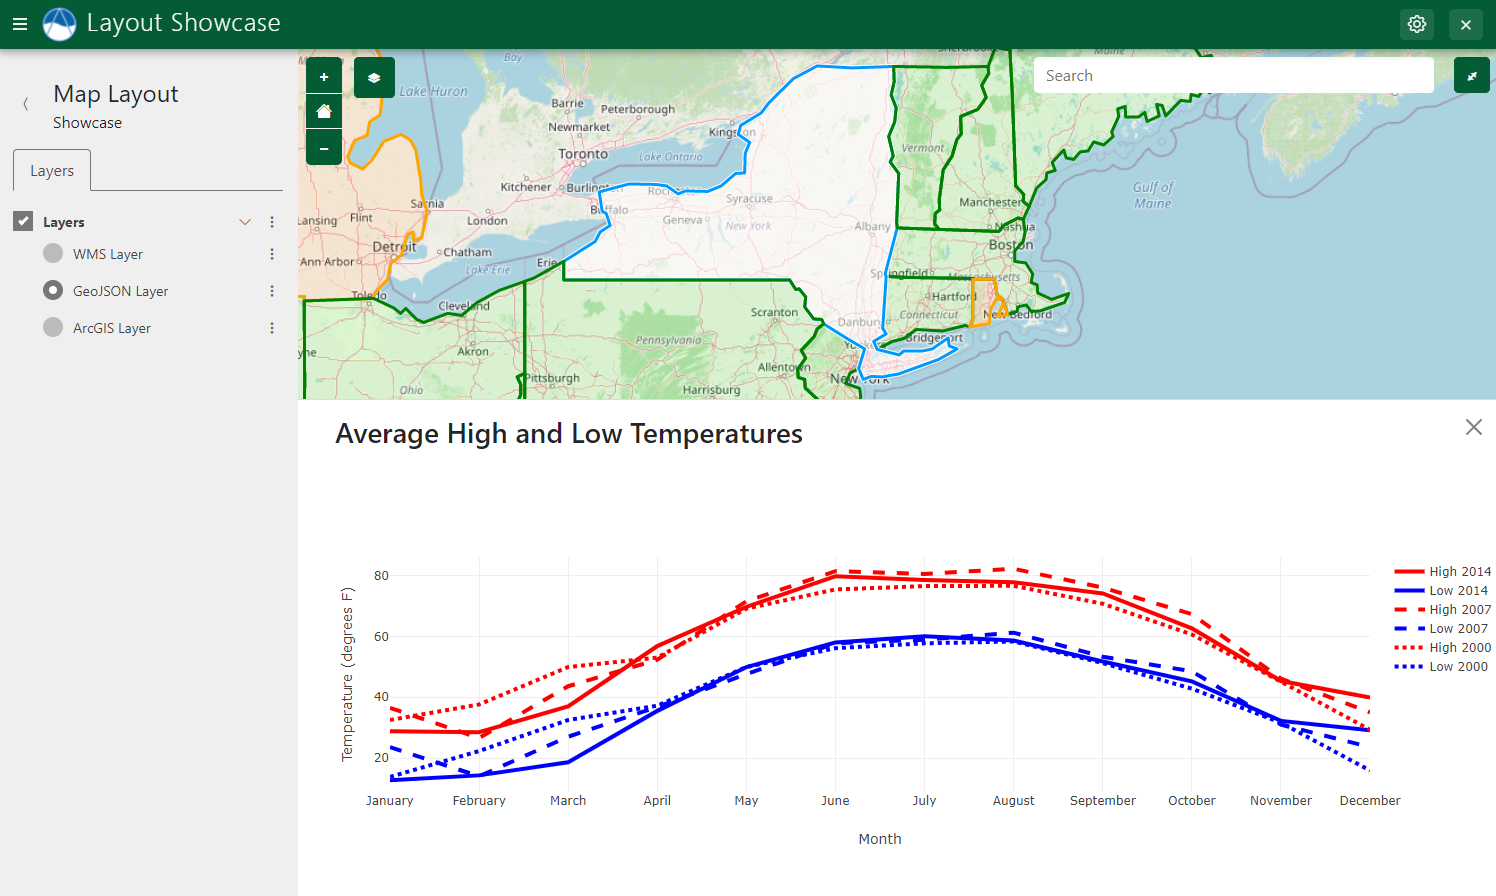
Figure 11: The Click and Plot feature can be used to plot data associated with selected features.
Enable the Plot Slide Sheet by setting the plot_slide_sheet property to True:
class MyMapLayout(MapLayout):
    plot_slide_sheet = True
Then enable the plot capability on one or more layers by setting the plottable argument to True:
# WMS Layer
usa_population = self.build_wms_layer(
    endpoint='http://localhost:8181/geoserver/wms',
    server_type='geoserver',
    layer_name='topp:states',
    layer_title='USA Population',
    layer_variable='population',
    visible=True,  # Set to False if the layer should be hidden initially
    selectable=True,
    plottable=True,
)
Note
This feature only works for the layer types supported by Feature Selection.
Finally, override the get_plot_for_layer_feature method of the MapLayout class. This method is called to retrive the plot data for a particular feature. The name of the layer and the id of the feature are given as arguments to allow for looking up the data dynamically.
The get_plot_for_layer_feature method should return three things:
title* (str): The title of the plot slide sheet.
data (list<dict>): A list of dictionaries containing the data series.
layout (dict): A dictionary with layout options for the plot.
The data series and layout objects should be the Python equivalent of the Plotly JSON objects (see: JavaScript Figure Reference | Plotly).
In this example, the plot data is hard-coded for simplicity:
def get_plot_for_layer_feature(self, request, layer_name, feature_id, layer_data, feature_props, *args, **kwargs):
    """
    Retrieves plot data for given feature on given layer.

    Args:
        layer_name (str): Name/id of layer.
        feature_id (str): ID of feature.
        layer_data (dict): The MVLayer.data dictionary.
        feature_props (dict): The properties of the selected feature.

    Returns:
        str, list<dict>, dict: plot title, data series, and layout options, respectively.
    """
    # Define data
    month = ['January', 'February', 'March', 'April', 'May', 'June', 'July',
            'August', 'September', 'October', 'November', 'December']
    high_2000 = [32.5, 37.6, 49.9, 53.0, 69.1, 75.4, 76.5, 76.6, 70.7, 60.6, 45.1, 29.3]
    low_2000 = [13.8, 22.3, 32.5, 37.2, 49.9, 56.1, 57.7, 58.3, 51.2, 42.8, 31.6, 15.9]

    layout = {
        'xaxis': {
            'title': 'Month'
        },
        'yaxis': {
            'title': 'Temperature (degrees F)'
        }
    }

    data = [
        {
            'name': 'High 2000',
            'mode': 'lines',
            'x': month,
            'y': high_2000,
            'line': {
                'dash': 'dot',
                'width': 4,
                'color': 'red'
            }
        }, {
            'name': 'Low 2000',
            'mode': 'lines',
            'x': month,
            'y': low_2000,
            'line': {
                'dash': 'dot',
                'width': 4,
                'color': 'blue'
            }
        }
    ]
    return 'Average High and Low Temperatures', data, layout
JavaScript
The plot slide sheet can be manipulated for more general purposes via the JavaScript API for MapLayout. Ensure that the plot_slide_sheet property of the MapLayout class is set to True to enable this functionality. See: get_plot, show_plot, hide_plot, update_plot, plot_loader, and plot_button_generator.
Tip
See the Custom Template and JavaScript section for how to define a custom template for a MapLayout and add custom JavaScript.
Address Search (Geocoding)
The Geocoding feature allows users to search for locations by street address or name.
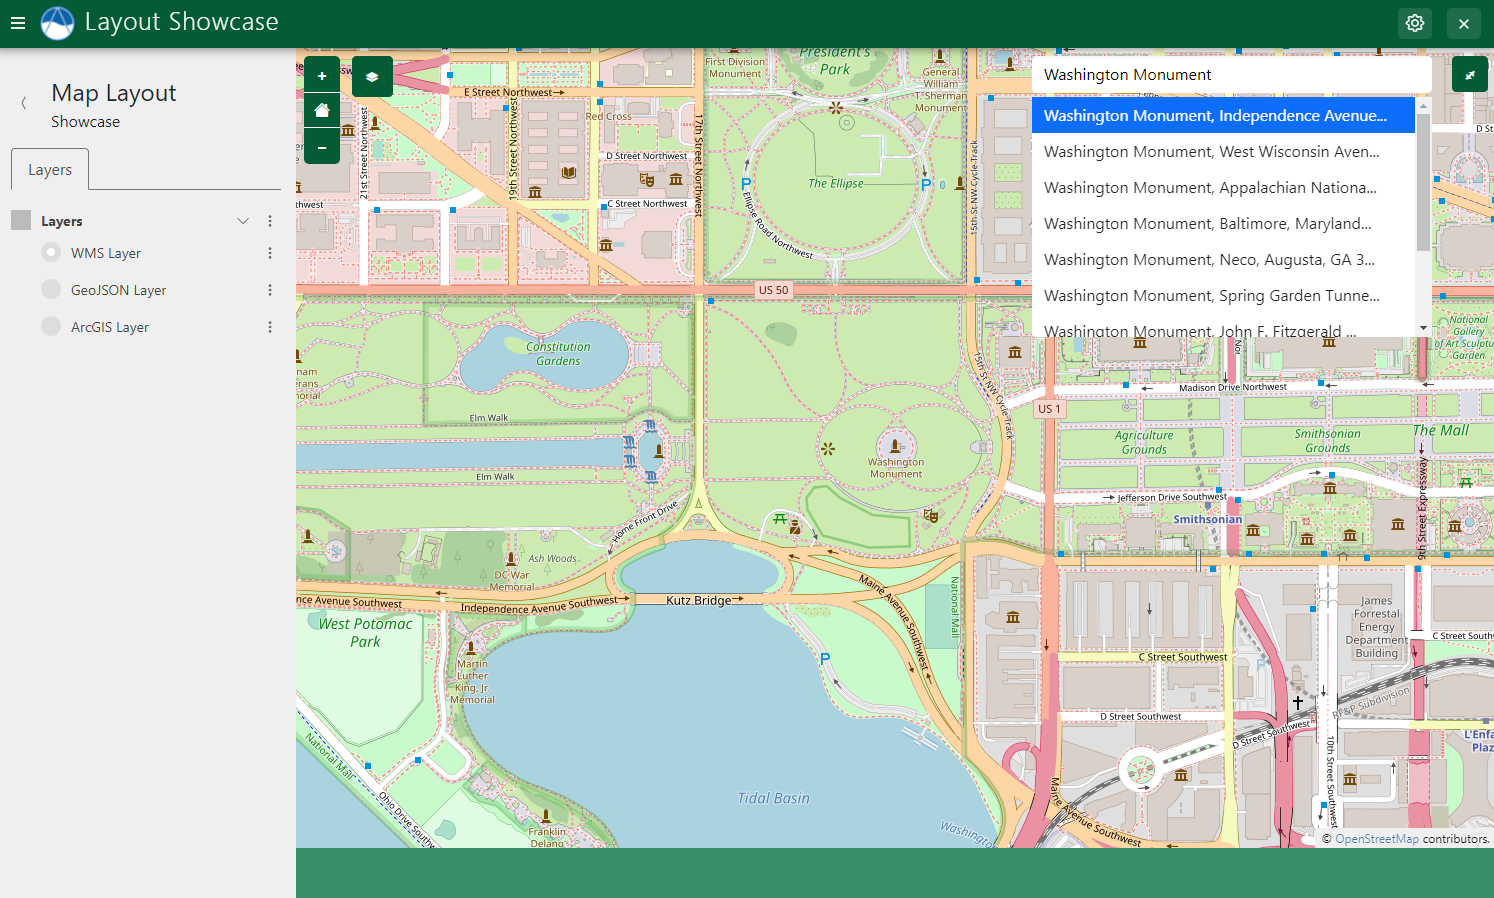
Figure 12: Use the Geocoding capability of Map Layout to perform address and location search.
The geocoding capability is powered by the OpenCage Geocoding API. You will need to create an account on OpenCage and obtain an API key. Then set the geocode_api_key to the value of your OpenCage API key:
class MyMapLayout(MapLayout):
    geocode_api_key = 'mY-@pI-k3y'
Tip
Rather than store the API Key in plain text in your source code, you can store it as an app setting and retrieve it using this pattern:
class MyMapLayout(MapLayout):

    @property
    def geocode_api_key(self):
        return self.app.get_custom_setting('open_cage_api_key')
Once the API key is set, a search box will appear on the MapLayout page. The search requires a minimum of 3 characters to be entered and no activity for 2 seconds before it attempts to search.
The search extent can be limited by providing setting the geocode_extent property:
class MyMapLayout(MapLayout):
    geocode_api_key = 'mY-@pI-k3y'
    geocode_extent = [-127.26563,23.56399,-66.09375,50.51343]
Permissions
Some of the features of MapView can be restricted to users with certain permissions. To enable permissions enforcement, first set the enforce_permissions property to True:
class MyMapLayout(MapLayout):
    enforce_permissions = True
Define the following permissions in the permissions() method of your app class (located in the app.py):
from tethys_sdk.permissions import Permission, PermissionGroup


class App(TethysAppBase):

    ...

    def permissions(self)
        # Define Permissions
        can_use_map_geocode = Permission(
            name='use_map_geocode',
            description='Can use the address search feature.'
        )

        can_use_map_plot = Permission(
            name='use_map_plot',
            description='Can use the click and plot capability.'
        )

        can_remove_layers = Permission(
            name='remove_layers',
            description='Can remove layerss'
        )

        can_rename_layers = Permission(
            name='rename_layers',
            description='Can rename layers.'
        )

        can_toggle_public_layer = Permission(
            name='toggle_public_layer',
            description='Can toggle the public toggle for layers.'
        )

        can_download = Permission(
            name='can_download',
            description='Can download layers.'
        )

        # Create map admin permission group
        map_admin_group = PermissionGroup(
            name='map_admin',
            permissions=(
                can_use_map_geocode, can_use_map_plot, can_remove_layers,
                can_rename_layers, can_toggle_public_layer, can_download
            )
        )

        return (map_admin_group,)
Finally, use the admin pages to assign individual permissions to users, create additional permissions groups, and assign them to users (see: tethys_portal_auth_admin).
Python API Documentation
MapLayout Class
Properties
The following properties can be overridden customize the behavior of the MapLayout. It is recommended that the following properties be overridden every time: app, base_template, map_subtitle, and map_title.
- class tethys_layouts.views.map_layout.MapLayout(**kwargs)
Controller for the MapLayout view. Create a class that extends this class and implement the
compose_layersmethod and other properties as desired. Decorate the class using thecontrollerdecorator to map it to a URL.- basemaps
Name of a basemap or list of basemaps that will be available on the map. Same as the MapView gizmo basemap argument. Does not apply to the Cesium renderer.
- Type:
list or str
- base_template
Template to use as base template. Recommend overriding this to be your app's base template. Defaults to "tethys_layouts/tethys_layout.html".
- Type:
str
- cesium_ion_token
Cesium Ion API token. Required if map_type is "cesium_map_view". See: https://cesium.com/learn/cesiumjs-learn/cesiumjs-quickstart/
- Type:
str
- default_map_extent = The default BBOX extent for the map. Defaults to [-65.69, 23.81, -129.17, 49.38].
- geocode_api_key
An Open Cage Geocoding API key. Required to enable address search/geocoding feature. See: https://opencagedata.com/api#quickstart
- Type:
str
- geocode_extent
Bounding box defining search area for address search feature (e.g.: [-65.69, 23.81, -129.17, 49.38]). Alternatively, set to 'map-extent' to use map extent.
- Type:
4-list
- geoserver_workspace
Name of the GeoServer workspace of layers if applicable. Defaults to None.
- Type:
str
- feature_selection_multiselect
Set to True to enable multi-selection when feature selection is enabled. Defaults to False.
- Type:
bool
- feature_selection_sensitivity
Feature selection sensitivity/relative search radius. Defaults to 4.
- Type:
int
- map_type
Type of map gizmo to use. One of "tethys_map_view" or "cesium_map_view". Defaults to "tethys_map_view".
- Type:
str
- plot_slide_sheet
Enables the Plotly slide sheet when True. Defaults to False. The slide sheet can be opened and populated using the JavaScript API.
- Type:
bool
- plotly_version
Version of Plotly library to load for Plotly slide sheet. Defaults to "2.3.0".
- Type:
str
- sds_setting_name
Name of a Spatial Dataset Service Setting in the app to pass to MapManager when initializing. The SDS will be retrieved as an engine and passed to the constructor of the MapManager using the kwarg "sds_engine".
- Type:
str
- show_custom_layer
Show the "Custom Layers" item in the Layers tree when True. Users can add WMS layers to the Custom Layers layer group dynamically. Defaults to True.
- Type:
bool
- show_map_clicks
Show where the user clicks when they click on the map. Defaults to False.
- Type:
bool
- show_map_click_popup
Display a pop-up pointing to the point where user clicks. Defaults to False.
- Type:
bool
Render Layout with a wider navigation menu on left. Defaults to False.
- Type:
bool
Override Methods
Override these methods to customize the behavior of the MapLayout for your application. For example, override the compose_layers method to add layers to the MapLayout.
compose_layers
- MapLayout.compose_layers(request, map_view, *args, **kwargs)
Compose layers and layer groups for the MapLayout and add to the given MapView. Use the built-in utility methods to build the MVLayer objects and layer group dictionaries. Returns a list of layer group dictionaries.
- Parameters:
request (HttpRequest) -- A Django request object.
map_view (MapView) -- The MapView gizmo to add layers to.
layer_data (dict) -- The MVLayer.data dictionary.
feature_props (dict) -- The properties of the selected feature.
- Returns:
The MapView, extent, and list of LayerGroup dictionaries.
- Return type:
list<LayerGroupDicts>
get_plot_for_layer_feature
- MapLayout.get_plot_for_layer_feature(request, layer_name, feature_id, layer_data, feature_props, *args, **kwargs)
Retrieves plot data for given feature on given layer.
- Parameters:
request (HttpRequest) -- A Django request object.
layer_name (str) -- Name/id of layer.
feature_id (str) -- Feature ID of feature.
layer_data (dict) -- Data attached to the layer with the data argument.
feature_props (dict) -- Feature type properties.
- Returns:
plot title, data series, and layout options, respectively.
- Return type:
str, list<dict>, dict
get_vector_style_map
should_disable_basemap
on_add_custom_layer
on_remove_tree_item
on_rename_tree_item
Helper Methods and Properties
These methods and properties simplify common workflows that are used in MapLayout implementations. Don't override these unless you know what you are doing.
build_map_extent_and_view
- MapLayout.build_map_extent_and_view(request, *args, **kwargs)
Builds the default MVView and BBOX extent for the map.
- Returns:
default view and extent of the project.
- Return type:
MVView, 4-list<float>
build_wms_layer
- classmethod MapLayout.build_wms_layer(endpoint, layer_name, layer_title, layer_variable, viewparams=None, env=None, visible=True, tiled=True, selectable=False, plottable=False, has_action=False, extent=None, public=True, geometry_attribute='geometry', layer_id='', excluded_properties=None, popup_title=None, color_ramp_division_kwargs=None, times=None, server_type='geoserver', cross_origin=None, styles=None, renamable=False, removable=False, show_legend=True, legend_url=None, cql_filter=None)
Build an WMS MVLayer object with supplied arguments.
- Parameters:
endpoint (str) -- URL to GeoServer WMS interface.
layer_name (str) -- Name of GeoServer layer (e.g.: workspace:a-unique-layer-name).
layer_title (str) -- Title of MVLayer (e.g.: Model Boundaries).
layer_variable (str) -- Variable type of the layer (e.g.: model_boundaries).
layer_id (UUID, int, str) -- layer_id for non geoserver layer where layer_name may not be unique.
viewparams (str) -- VIEWPARAMS string.
env (str) -- ENV string.
visible (bool) -- Layer is visible when True. Defaults to True.
public (bool) -- Layer is publicly accessible when app is running in Open Portal Mode if True. Defaults to True.
tiled (bool) -- Configure as tiled layer if True. Defaults to True.
selectable (bool) -- Enable feature selection. Defaults to False.
plottable (bool) -- Enable "Plot" button on pop-up properties. Defaults to False.
has_action (bool) -- Enable "Action" button on pop-up properties. Defaults to False.
extent (list) -- Extent for the layer. Optional.
popup_title (str) -- Title to display on feature popups. Defaults to layer title.
excluded_properties (list) -- List of properties to exclude from feature popups.
geometry_attribute (str) -- Name of the geometry attribute. Defaults to "geometry".
color_ramp_division_kwargs (dict) -- arguments from MapLayout.generate_custom_color_ramp_divisions
times (list) -- List of time steps if layer is time-enabled. Times should be represented as strings in ISO 8601 format (e.g.: ["20210322T112511Z", "20210322T122511Z", "20210322T132511Z"]). Currently only supported in CesiumMapView.
server_type (str) -- One of 'geoserver' or 'thredds'. Defaults to 'geoserver'.
cross_origin (str) -- Value to pass to crossOrigin property. Defaults to None. See: https://openlayers.org/en/latest/apidoc/module-ol_source_TileWMS-TileWMS.html
styles (str) -- Name of style to render the WMS. Defaults to None.
renamable (bool) -- Show Rename option in layer context menu when True. Must implement the appropriate method to persist the change. Defaults to False.
removable (bool) -- Show Remove option in layer context menu when True. Must implement the appropriate method to persist the change. Defaults to False.
show_legend (bool) -- Show the legend for this layer when True and legends are enabled. Defaults to True.
legend_url (str) -- URL of a legend image to display for the layer when legends are enabled.
cql_filter (str) -- geoserver CQL filter string.
- Returns:
the MVLayer object.
- Return type:
build_geojson_layer
- classmethod MapLayout.build_geojson_layer(geojson, layer_name, layer_title, layer_variable, layer_id='', visible=True, public=True, selectable=False, plottable=False, has_action=False, extent=None, popup_title=None, excluded_properties=None, show_download=False, renamable=False, removable=False, show_legend=True, legend_url=None, label_options=None)
Build an MVLayer object with supplied arguments.
- Parameters:
geojson (dict) -- Python equivalent GeoJSON FeatureCollection.
layer_name (str) -- Name of GeoServer layer (e.g.: workspace:a-unique-layer-name).
layer_title (str) -- Title of MVLayer (e.g.: Model Boundaries).
layer_variable (str) -- Variable type of the layer (e.g.: model_boundaries).
layer_id (UUID, int, str) -- layer_id for non geoserver layer where layer_name may not be unique.
visible (bool) -- Layer is visible when True. Defaults to True.
public (bool) -- Layer is publicly accessible when app is running in Open Portal Mode if True. Defaults to True.
selectable (bool) -- Enable feature selection. Defaults to False.
plottable (bool) -- Enable "Plot" button on pop-up properties. Defaults to False.
has_action (bool) -- Enable "Action" button on pop-up properties. Defaults to False.
extent (list) -- Extent for the layer. Optional.
popup_title (str) -- Title to display on feature popups. Defaults to layer title.
excluded_properties (list) -- List of properties to exclude from feature popups.
show_download (boolean) -- enable download geojson as shapefile. Default is False.
renamable (bool) -- Show Rename option in layer context menu when True. Must implement the appropriate method to persist the change. Defaults to False.
removable (bool) -- Show Remove option in layer context menu when True. Must implement the appropriate method to persist the change. Defaults to False.
show_legend (bool) -- Show the legend for this layer when True and legends are enabled. Defaults to True.
legend_url (str) -- URL of a legend image to display for the layer when legends are enabled.
label_options (dict) -- Dictionary for labeling. Possibilities include label_property (the name of the property to label), font (label font), text_align (alignment of the label), offset_x (x offset). Optional.
- Returns:
the MVLayer object.
- Return type:
build_arc_gis_layer
- classmethod MapLayout.build_arc_gis_layer(endpoint, layer_name, layer_title, layer_variable, layer_id=None, visible=True, selectable=False, extent=None, public=True, renamable=False, removable=False, show_legend=True, legend_url=None)
Build an AcrGIS Map Server MVLayer object with supplied arguments.
- Parameters:
endpoint (str) -- Full ArcGIS REST URL for the layer (e.g.: "https://sampleserver1.arcgisonline.com/ArcGIS/rest/services/Specialty/ESRI_StateCityHighway_USA/MapServer").
layer_name (str) -- Programmatic name of the layer (e.g.: "ESRI_StateCityHighway_USA").
layer_title (str) -- Title of layer to display in Layer Picker (e.g.: "ESRI Highways").
layer_variable (str) -- Variable type/class of the layer (e.g.: "highways").
layer_id (UUID, int, str) -- layer_id for non geoserver layer where layer_name may not be unique.
visible (bool) -- Layer is visible when True. Defaults to True.
public (bool) -- Layer is publicly accessible when app is running in Open Portal Mode if True. Defaults to True.
extent (list) -- Extent for the layer. Optional.
renamable (bool) -- Show Rename option in layer context menu when True. Must implement the appropriate method to persist the change. Defaults to False.
removable (bool) -- Show Remove option in layer context menu when True. Must implement the appropriate method to persist the change. Defaults to False.
show_legend (bool) -- Show the legend for this layer when True and legends are enabled. Defaults to True.
legend_url (str) -- URL of a legend image to display for the layer when legends are enabled.
- Returns:
the MVLayer object.
- Return type:
build_layer_group
- classmethod MapLayout.build_layer_group(id, display_name, layers, layer_control='checkbox', visible=True, public=True, collapsed=False, renamable=False, removable=False)
Build a layer group object.
- Parameters:
id (str) -- Unique identifier for the layer group.
display_name (str) -- Name displayed in MapView layer selector/legend.
layers (list<MVLayer>) -- List of layers to include in the layer group.
layer_control (str) -- Type of control for layers. Either 'checkbox' or 'radio'. Defaults to checkbox.
visible (bool) -- Whether layer group is initially visible. Defaults to True.
public (bool) -- Enable public to see this layer group if True.
collapsed (bool) -- Render layer group collapsed initially. Defaults to False.
renamable (bool) -- Show Rename option in layer context menu when True. Must implement the appropriate method to persist the change. Defaults to False.
removable (bool) -- Show Remove option in layer context menu when True. Must implement the appropriate method to persist the change. Defaults to False.
- Returns:
Layer group definition.
- Return type:
dict
build_legend
- classmethod MapLayout.build_legend(layer, units='')
Build Legend data for a given layer
- Parameters:
layer (MVLayer) -- An MVLayer object built using MapLayout.build_wms_layer().
units (str) -- unit for the legend.
- Returns:
Legend data associated with the layer.
- Return type:
dict
generate_custom_color_ramp_divisions
- classmethod MapLayout.generate_custom_color_ramp_divisions(min_value, max_value, num_divisions=10, value_precision=2, first_division=1, top_offset=0, bottom_offset=0, prefix='val', color_ramp=None, color_prefix='color', no_data_value=None)
Generate custom color ramp divisions.
- Parameters:
min_value (float) -- minimum value.
max_value (float) -- maximum value.
num_divisions (int) -- number of divisions.
value_precision (int) -- level of precision for legend values.
first_division (int) -- first division number (defaults to 1).
top_offset (float) -- offset from top of color ramp (defaults to 0).
bottom_offset (float) -- offset from bottom of color ramp (defaults to 0).
prefix (str) -- name of division variable prefix (i.e.: 'val' for pattern 'val1').
color_ramp (str) -- color ramp name in COLOR_RAMPS dict. Options are 'Blue', 'Blue and Red', 'Flower Field', 'Galaxy Berries', 'Heat Map', 'Olive Harmony', 'Mother Earth', 'Rainforest Frogs', 'Retro FLow', or 'Sunset Fade'.
color_prefix (str) -- name of color variable prefix (i.e.: 'color' for pattern 'color1').
no_data_value (str) -- set no data value for the color ramp. (defaults to None).
- Returns:
Color ramp division names and values.
- Return type:
dict<name, value>
build_param_string
convert_geojson_to_shapefile
- MapLayout.convert_geojson_to_shapefile(request, *args, **kwargs)
- AJAX handler that converts GeoJSON data into a shapefile for download.
Credit to: https://github.com/TipsForGIS-zz/geoJSONToShpFile/blob/master/geoJ.py
Important
This method requires the pyshp library to be installed. Starting with Tethys 5.0 or if you are using micro-tethys-platform, you will need to install django-json-widget using conda or pip as follows:
# conda: conda-forge channel strongly recommended
conda install -c conda-forge pyshp

# pip
pip install pyshp
Don't Forget: If you end up using this method in your app, add pyshp as a requirement to your install.yml.
- Parameters:
request (HttpRequest) -- The request.
- Returns:
success.
- Return type:
JsonResponse
JavaScript API Documentation
In addition to providing it's own JavaScript API, the MapLayout uses the MapView gizmo under the covers which means, many of the MapView gizmo JavaScript capabilities are applicable.
MapLayout
Properties Popups
show_properties_popup
MAP_LAYOUT.show_properties_popup(coordinates)
Show the properties popup at the location given.
Parameters
coordinates (ol.geom.Point*|*Array): An
ol.goem.Pointor anArrayof length 2 (e.g.[-11981657.512845377, 4615036.7485996075]). Coordinates should be specified in theEPSG:3857coordinate system.
close_properties_popup
MAP_LAYOUT.close_properties_popup()
Hides the properties popup and clears the features selected.
hide_properties_popup
MAP_LAYOUT.hide_properties_popup()
Hides the properties popup without clearing selection.
reset_properties_popup
MAP_LAYOUT.reset_properties_popup()
Empties content of properties popup and then hides it.
properties_table_generator
MAP_LAYOUT.properties_table_generator(f)
Override the default function that is used to generate the properties table that is displayed in the feature selection properties popup.
Parameters
function: Provide a function that accepts two arguments,
featureandlayer, and returns a string containing the HTML markup to insert into the popup.
custom_properties_generator
MAP_LAYOUT.custom_properties_generator(f)
Define a function that is used to generate content to display in the popup after the properties table.
Parameters
f (function): Provide a function that accepts two arguments,
featureandlayer, and returns a string containing the HTML markup to insert in the popup after the properties table.
custom_properties_initializer
MAP_LAYOUT.custom_properties_initializer(f)
Define a function that performs initialization operations for custom content after the custom content markup is rendered (e.g. initialize a plot).
Parameters
f (function): Provide a function that accepts no arguments and performs the initialization of custom content in the popup.
Plot Slide Sheet
get_plot
MAP_LAYOUT.get_plot()
Return the selector for the Plotly plot element for use in Plotly functions.
show_plot
MAP_LAYOUT.show_plot()
Open/show the slide sheet containing the plot.
hide_plot
MAP_LAYOUT.hide_plot()
Close/hide the slide sheet containing the plot.
update_plot
MAP_LAYOUT.update_plot(title, data, layout)
Update the Plotly plot and slide sheet with the given title, data, and layout objects. Uses the
Plotly.react()method to do this efficiently.Parameters
title (str): Title of the plot slide sheet.
data (array<object>): JavaScript array of objects, one for each data series.
layout (object): JavaScript object with Layout options for the plot.
plot_loader
MAP_LAYOUT.plot_loader(f)
Override the default plot loading function.
Parameters
f (function): A JavaScript function to be called whenever plot data needs to be loaded. Must accept three arguments:
plot_button,layer_name, andfeature_id.