Click to Plot Using JavaScript
Last Updated: September 2025
This recipe will demonstrate how to implement click to plot features using JavaScript, allowing you to place your map wherever you'd like in your page. We'll be using the MapView Gizmo and the Plotly Gizmo to do this.
This recipe builds on the Map View Feature Popup Recipe
Adding Plot Data
Begin by adding the following data inside your controllers.py file. This data will correspond to the features you added to your map view in the Map View Feature Popup Recipe previously.
plot_data = {
    1: {
        "x": [1, 2, 3, 4, 5],
        "y": [10, 15, 13, 17, 22],
    },
    2: {
        "x": [1, 2, 3, 4, 5],
        "y": [16, 5, 11, 9, 15],
    },
    3: {
        "x": [1, 2, 3, 4, 5],
        "y": [12, 9, 15, 12, 10],
    },
    4: {
        "x": [1, 2, 3, 4, 5],
        "y": [9, 12, 10, 15, 12],
    },
    5: {
        "x": [1, 2, 3, 4, 5],
        "y": [10, 13, 14, 10, 15],
    },
}
You'll be plotting this data onto a graph in your app in just a moment.
Add Plot Data Endpoint
Before we move onto the JavaScript portion, you'll need to add a controller to retrieve this data to use in your JavaScript. Add this controller in your controllers.py file:
from django.http import JsonResponse
...

@controller(url='get-plot-data/{feature_id}')
def get_plot_data(request, feature_id):
    feature_id = int(feature_id)
    data = plot_data.get(feature_id)
    return JsonResponse(data)
Add a Plot button
Next, we'll be adding a 'Plot' button to your popup to click on and display your feature's data on a graph.
Begin by adding these lines to your select interaction code:
...
selectInteraction.on('select', function(event) {
    let feature = event.selected[0];
    console.log("Feature properties: ", feature.getProperties());
    console.log("Metadata: ", feature);
    const coordinate = feature.getGeometry().getCoordinates();

    console.log("Coordinate: ", coordinate);

    content.innerHTML = `
        <h3>${feature.get("name")}</h3>
        <table class="table table-striped table-bordered">
            <tr>
                <td>Longitude</td>
                <td>${coordinate[0].toFixed(3)}</td>
            </tr>
            <tr>
                <td>Latitude</td>
                <td>${coordinate[1].toFixed(3)}</td>
            </tr>
            <tr>
                <td>Country</td>
                <td>${feature.get("country")}</td>
            </tr>
        </table>
        <button class="btn btn-primary plot-button">Plot</button>
        `;

    overlay.setPosition(coordinate);

    document.querySelector('.plot-button').addEventListener('click', function() {
        plotData(feature.get("id"));
    });
});
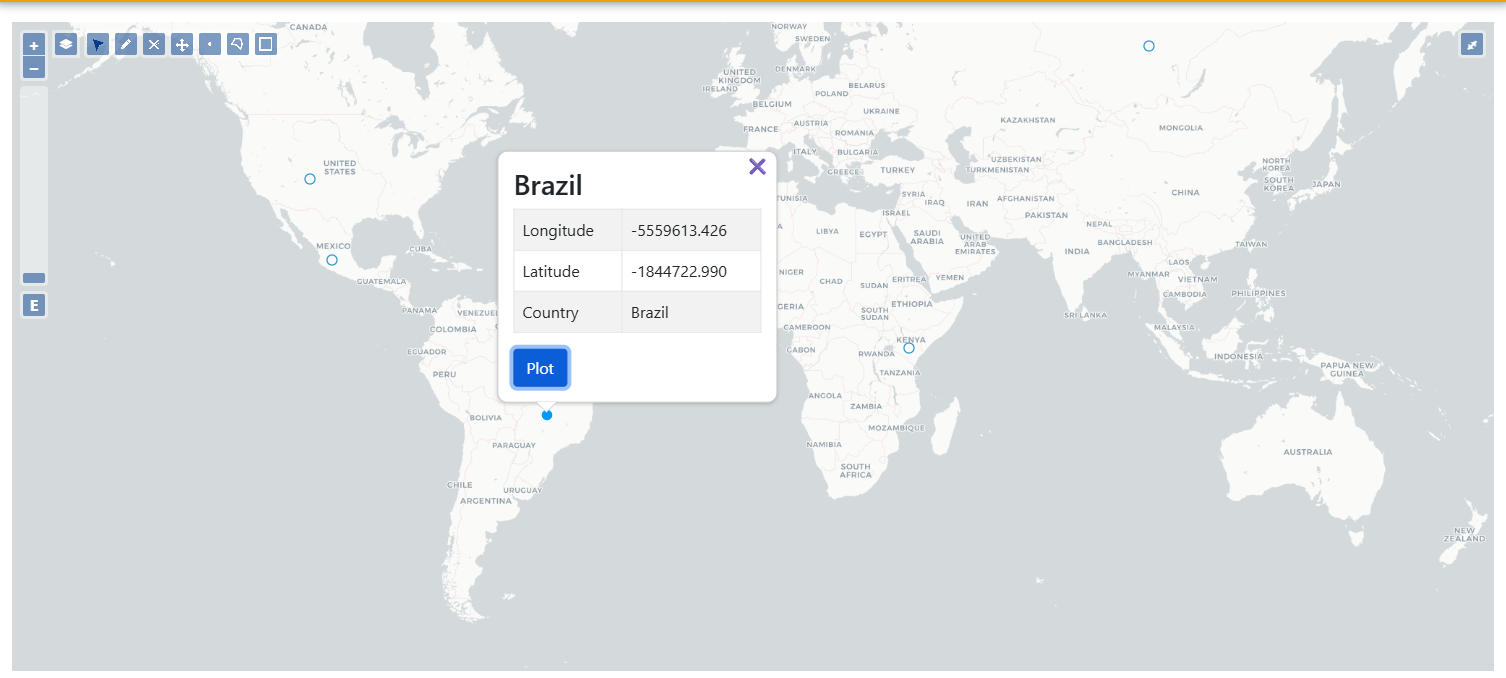
Reopen your app and click on a feature on the map, and you should see a 'Plot' button in the popup above that feature, just like this:
Add Space for Plot
Now, make a few adjustments to your main app page:
{% block app_content %}
    <div class="row">
        <div class="col-6">
            <div class="map-container h-100">
                {% gizmo map_view %}
            </div>
        </div>
        <div class="col-6">
            <div id="plot-container"></div>
        </div>
    </div>
{% endblock %}
You'll also need some styling updates. Add the following to your main.css file:
These changes will assign your map to half the app contents area space, and add a space for the plot on its right.
Add Plotting Functionality in JavaScript
Next, you'll need to add the plotData function in your JavaScript file outside the $(document).ready() block:
function plotData(featureId, featureProperties) {
    const plotContainer = document.querySelector('.plot-container');
    $('#plot-container').html(
        '<div id="plot-loader">' +
            '<img src="/static/test_plot_app/images/plot-loader.gif">' +
        '</div>'
    );
    $("#plot-container").html(`<div id="plot-div"></div>`);

    $.ajax({
        url: `get-plot-data-javascript/${featureId}`,
        type: 'GET',
        dataType: 'json',
        success: function(data) {
            console.log("Data received: ", data);
            let trace = {
                x: data.x,
                y: data.y,
                type: 'scatter',
                mode: 'lines+markers',
                name: `${featureProperties.country}`
            };

            let layout = {
                title: `Data for ${featureProperties.country}`,
                margin: { t: 40, l: 40, r: 10, b: 40 },
            };

            Plotly.newPlot('plot-div', [trace], layout);
        },
    })
}
Now, just go ahead and reload your app and click on a feature, then the 'plot' button that is now on the small popup. You should see something like this:
