Bokeh Integration Concepts
Last Updated: November 2019
This tutorial introduces Bokeh Server integration concepts for Tethys developers. Two bokeh handlers will be created to demonstrate how to link Bokeh plots or widgets to Python functions in the brackground using both a plain Bokeh approach as well as a Param approach. The topics covered include:
Bokeh Server
Handler functions using Bokeh Widgets
Handler functions using Param and Panel
Create a and install a new Tethys app named bokeh_tutorial.
t
tethys scaffold bokeh_tutorial
cd tethysapp-bokeh_tutorial
tethys install -d
1. Bokeh Server
Bokeh is an interactive visualization library for Python. Bokeh Server is a component of the Bokeh architecture. It provides a way to sync model objects in Python on the backend to JavaScript model objects on the client. This is done by levering the Websocket protocol. With the addition of Django Channels to Tethys, this ability to sync backend python objects and frontend plots has also been integrated without the need of other components such as a Tornado server (see Tethys Bokeh Integration documentation). This integration facilitates the linking of objects and Bokeh widgets as well as the creation of the necessary websocket and http consumers.
The logic for creating a Bokeh widget along with other related functionality is provided in a handler function. This handler will be associated to a specific controller function where the resulting Bokeh widget will be displayed in a later step.
2. Handler Functions Using Bokeh Widgets
Let's use Bokeh's sea temperature sample data to create a time series plot and link it to a slider that will provide the value to perform a rolling-window analysis on the time series. This example is based on a similar example in Bokeh's main documentation.
Create a
handler functionby adding the following imports and logic tocontroller.py.
from bokeh.plotting import figure
from bokeh.models import ColumnDataSource
from bokeh.sampledata.sea_surface_temperature import sea_surface_temperature

...

def home_handler(document):
    df = sea_surface_temperature.copy()
    source = ColumnDataSource(data=df)

    plot = figure(x_axis_type="datetime", y_range=(0, 25), y_axis_label="Temperature (Celsius)",
                  height=500, width=800, title="Sea Surface Temperature at 43.18, -70.43")
    plot.line("time", "temperature", source=source)

    document.add_root(plot)
This simple handler contains the logic for a time series plot of the sea surface temperature sample data provided by Bokeh.
Clear the default home function in
controller.pyand add the following code to it.
from bokeh.embed import server_document

@login_required()
def home(request):
    script = server_document(request.build_absolute_uri())
    context = {'script': script}
    return render(request, 'bokeh_tutorial/home.html', context)
The home controller can now load the time series plot from (a) using the Bokeh server_document function. However, we still need to link the handler and the controller in the app.py, and add the script context variable to the template as with any other variable.
Modify
app.pyby adding a dot-formatted path to the handler function created in (1) to thehandlerparameter and providing ahandler_typewith a value equal to 'bokeh' as shown in the code below.
from tethys_sdk.base import TethysAppBase, url_map_maker


class BokehTutorial(TethysAppBase):
    """
    Tethys app class for Bokeh Tutorial.
    """

    name = 'Bokeh Tutorial'
    index = 'bokeh_tutorial:home'
    icon = 'bokeh_tutorial/images/icon.gif'
    package = 'bokeh_tutorial'
    root_url = 'bokeh-tutorial'
    color = '#2980b9'
    description = ''
    tags = ''
    enable_feedback = False
    feedback_emails = []

    def url_maps(self):
        """
        Add controllers
        """
        UrlMap = url_map_maker(self.root_url)

        url_maps = (
            UrlMap(
                name='home',
                url='bokeh-tutorial',
                controller='bokeh_tutorial.controllers.home',
                handler='bokeh_tutorial.controllers.home_handler',
                handler_type='bokeh'
            ),
        )

        return url_maps
Clear the default
home.htmltemplate and add the following code to it.
{% extends "bokeh_tutorial/base.html" %}
{% load tethys_gizmos %}

{% block app_content %}
  <h1>Bokeh Integration Example</h1>
  {{ script|safe }}
{% endblock %}
As you can see, the script context variable has been added to the app_content block. If you start tethys and go to the home page of this app you should see something like this:
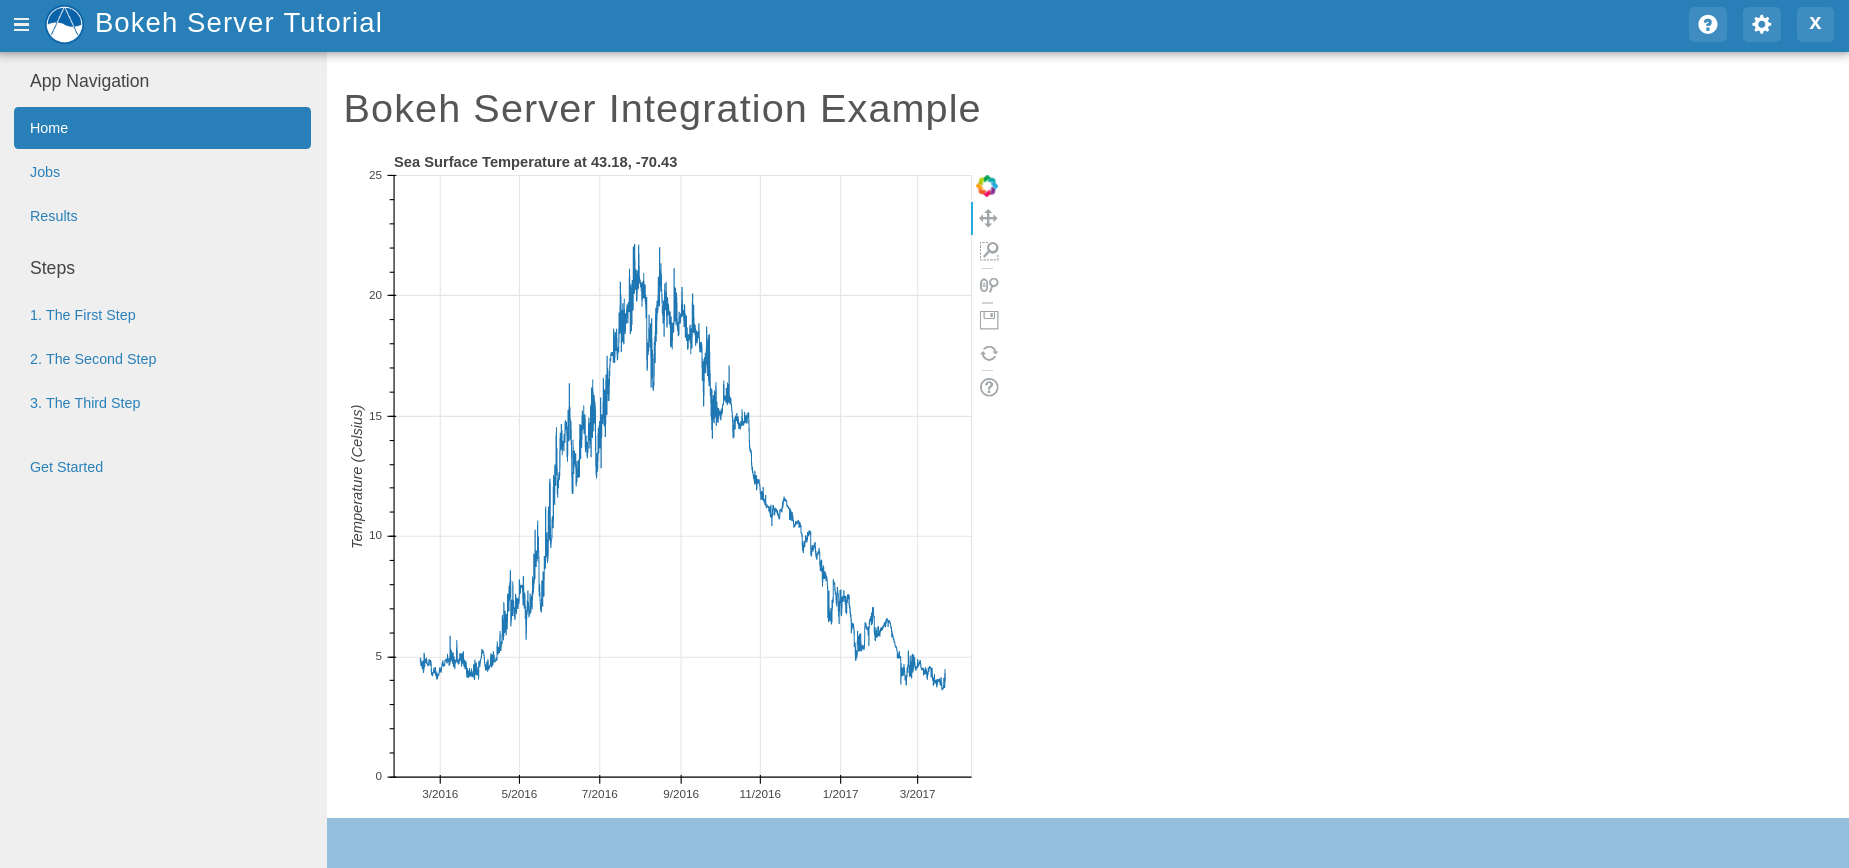
This is a simple Bokeh plot. We will now add the rest of the logic to make it an interactive plot. We will add a Slider widget. Then, we will create a callback function to modify the time-series plot based on the slider. Finally, we will add both our plot and slider to the document tree using a Column layout.
Modify the
handler functionfromcontroller.pyto look like this.
from bokeh.models import ColumnDataSource, Slider
from bokeh.layouts import column

...

def home_handler(document):
    df = sea_surface_temperature.copy()
    source = ColumnDataSource(data=df)

    plot = figure(x_axis_type="datetime", y_range=(0, 25), y_axis_label="Temperature (Celsius)",
                  height=500, width=800, title="Sea Surface Temperature at 43.18, -70.43")
    plot.line("time", "temperature", source=source)

    slider = Slider(start=0, end=30, value=0, step=1, title="Smoothing by N Days")

    def callback(attr, old, new):
        if new == 0:
            data = df
        else:
            data = df.rolling(f'{new}D').mean()
        source.data = dict(ColumnDataSource(data=data).data)

    slider.on_change("value", callback)

    document.add_root(column(slider, plot))
If you start tethys and go to the home page of this app you should see something like this:
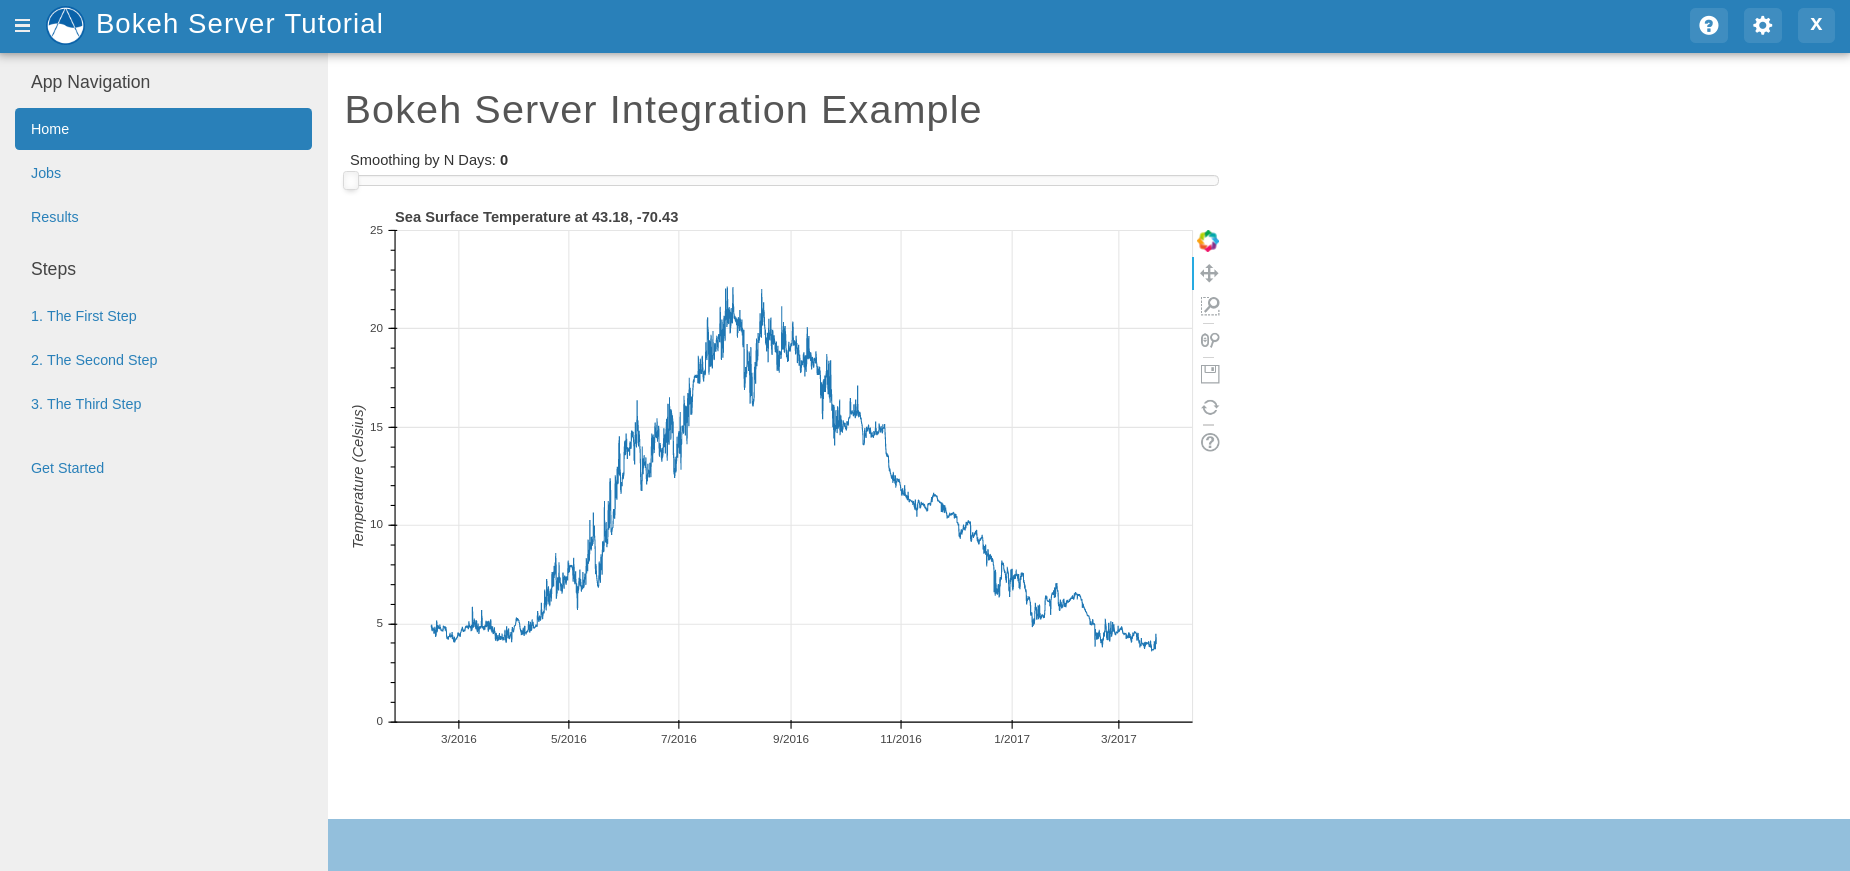
The Slider and Plot will appear in the order they were added to the Column layout. If the value of the Slider changes, the data in the Plot will reflect this change based on this expression: data = df.rolling(f'{new}D').mean(). Where df is the sample data and new is the new Slider value.
3. Handler Functions Using Param and Panel
Param is a Python library for providing parameters with dynamically generated values. One of the main advantages of Param is that parameters are provided using declarative programming. Panel, on the other hand, is a visualization library for creating custom dashboards that rely on the use of widgets to render plots, images, and tables. These libraries can be used in combination with Bokeh Server to attain the same result of creating interactive tools within an app that are connected to Python objects. Given the depth of these libraries, the resulting code structure, and the level of difficulty for creating complex visualizations may be simplified.
In this example we will build on top of the bokeh_tutorial app to demonstrate how to use Param and Panel in combination with bokeh Server. This same example can be found in Panel's documentation.
Install the
paramlibrary by running the following with your Tethys environment activated:
conda install -c conda-forge panel param
Add the new dependencies to your
install.ymlas follows so that the app will work when installed in a new environment:
# This file should be committed to your app code.
version: 1.0
# This should match the app - package name in your setup.py
name: bokeh_tutorial

requirements:
  # Putting in a skip true param will skip the entire section. Ignoring the option will assume it be set to False
  skip: false
  conda:
    channels:
      - conda-forge
    packages:
      - panel
      - param

  pip:

post:
Add the following objects to a new file called
param_model.py.
import param
import panel as pn
import numpy as np
from bokeh.plotting import figure

...


class Shape(param.Parameterized):
    radius = param.Number(default=1, bounds=(0, 1))

    def __init__(self, **params):
        super(Shape, self).__init__(**params)
        self.figure = figure(x_range=(-1, 1), y_range=(-1, 1), width=500, height=500)
        self.renderer = self.figure.line(*self._get_coords())

    def _get_coords(self):
        return [], []

    def view(self):
        return self.figure


class Circle(Shape):
    n = param.Integer(default=100, precedence=-1)

    def __init__(self, **params):
        super(Circle, self).__init__(**params)

    def _get_coords(self):
        angles = np.linspace(0, 2 * np.pi, self.n + 1)
        return (self.radius * np.sin(angles),
                self.radius * np.cos(angles))

    @param.depends('radius', watch=True)
    def update(self):
        xs, ys = self._get_coords()
        self.renderer.data_source.data.update({'x': xs, 'y': ys})


class NGon(Circle):
    n = param.Integer(default=3, bounds=(3, 10), precedence=1)

    @param.depends('radius', 'n', watch=True)
    def update(self):
        xs, ys = self._get_coords()
        self.renderer.data_source.data.update({'x': xs, 'y': ys})


shapes = [NGon(name='NGon'), Circle(name='Circle')]


class ShapeViewer(param.Parameterized):
    shape = param.ObjectSelector(default=shapes[0], objects=shapes)

    @param.depends('shape')
    def view(self):
        return self.shape.view()

    @param.depends('shape', 'shape.radius')
    def title(self):
        return '## %s (radius=%.1f)' % (type(self.shape).__name__, self.shape.radius)

    def panel(self):
        return pn.Column(self.title, self.view)
The added classes depend on Bokeh. The Circle and NGon classes depend on the Shape class, while the ShapeViewer allows the user to pick one of the two available shapes.
Add a
handler functionthat uses the classes created in the previous step by adding the following code tocontroller.py.
import panel as pn
from .param_model import ShapeViewer

...

def shapes_handler(document):
    viewer = ShapeViewer()
    panel = pn.Row(viewer.param, viewer.panel())
    panel.server_doc(document)
Add a
controller functionto pass thePanelobject to a template and to link it with thehandlercreated in the previous step.
def shapes_with_panel(request):
    script = server_document(request.build_absolute_uri())
    context = {'script': script}
    return render(request, "bokeh_tutorial/shapes.html", context)
Create a new
UrlMapinapp.pyto link the newhandler-controller pairto an endpoint.
def url_maps(self):
    """
    Add controllers
    """
    UrlMap = url_map_maker(self.root_url)

    url_maps = (
        UrlMap(
            name='home',
            url='bokeh-tutorial',
            controller='bokeh_tutorial.controllers.home',
            handler='bokeh_tutorial.controllers.home_handler',
            handler_type='bokeh'
        ),
        UrlMap(
            name='shapes',
            url='bokeh-tutorial/shapes',
            controller='bokeh_tutorial.controllers.shapes_with_panel',
            handler='bokeh_tutorial.controllers.shapes_handler',
            handler_type='bokeh'
        ),
    )

    return url_maps
Add a new template to match the path rendered in the new
controllerfrom (c) (bokeh_tutorial/shapes.html).
{% extends "bokeh_tutorial/base.html" %}
{% load tethys_gizmos %}

{% block header_buttons %}
  <div class="header-button glyphicon-button" data-toggle="tooltip" data-placement="bottom" title="Help">
    <a data-toggle="modal" data-target="#help-modal"><span class="glyphicon glyphicon-question-sign"></span></a>
  </div>
{% endblock %}

{% block app_content %}
  <h1>Bokeh Integration Example using Param and Panel</h1>
  {{ script|safe }}
{% endblock %}
To add the new endpoint to the app navigation bar, go to the
base.htmltemplate and replace theapp_navigationblock content with the code below.
{% block app_navigation_items %}
  {% url 'bokeh_tutorial:home' as home_url %}
  {% url 'bokeh_tutorial:shapes' as shapes_url %}
  <li class="title">Examples</li>
  <li class="{% if request.path == home_url %}active{% endif %}"><a href="{{ home_url }}">Sea Surface</a></li>
  <li class="{% if request.path == shapes_url %}active{% endif %}"><a href="{{ shapes_url }}">Shapes</a></li>
{% endblock %}
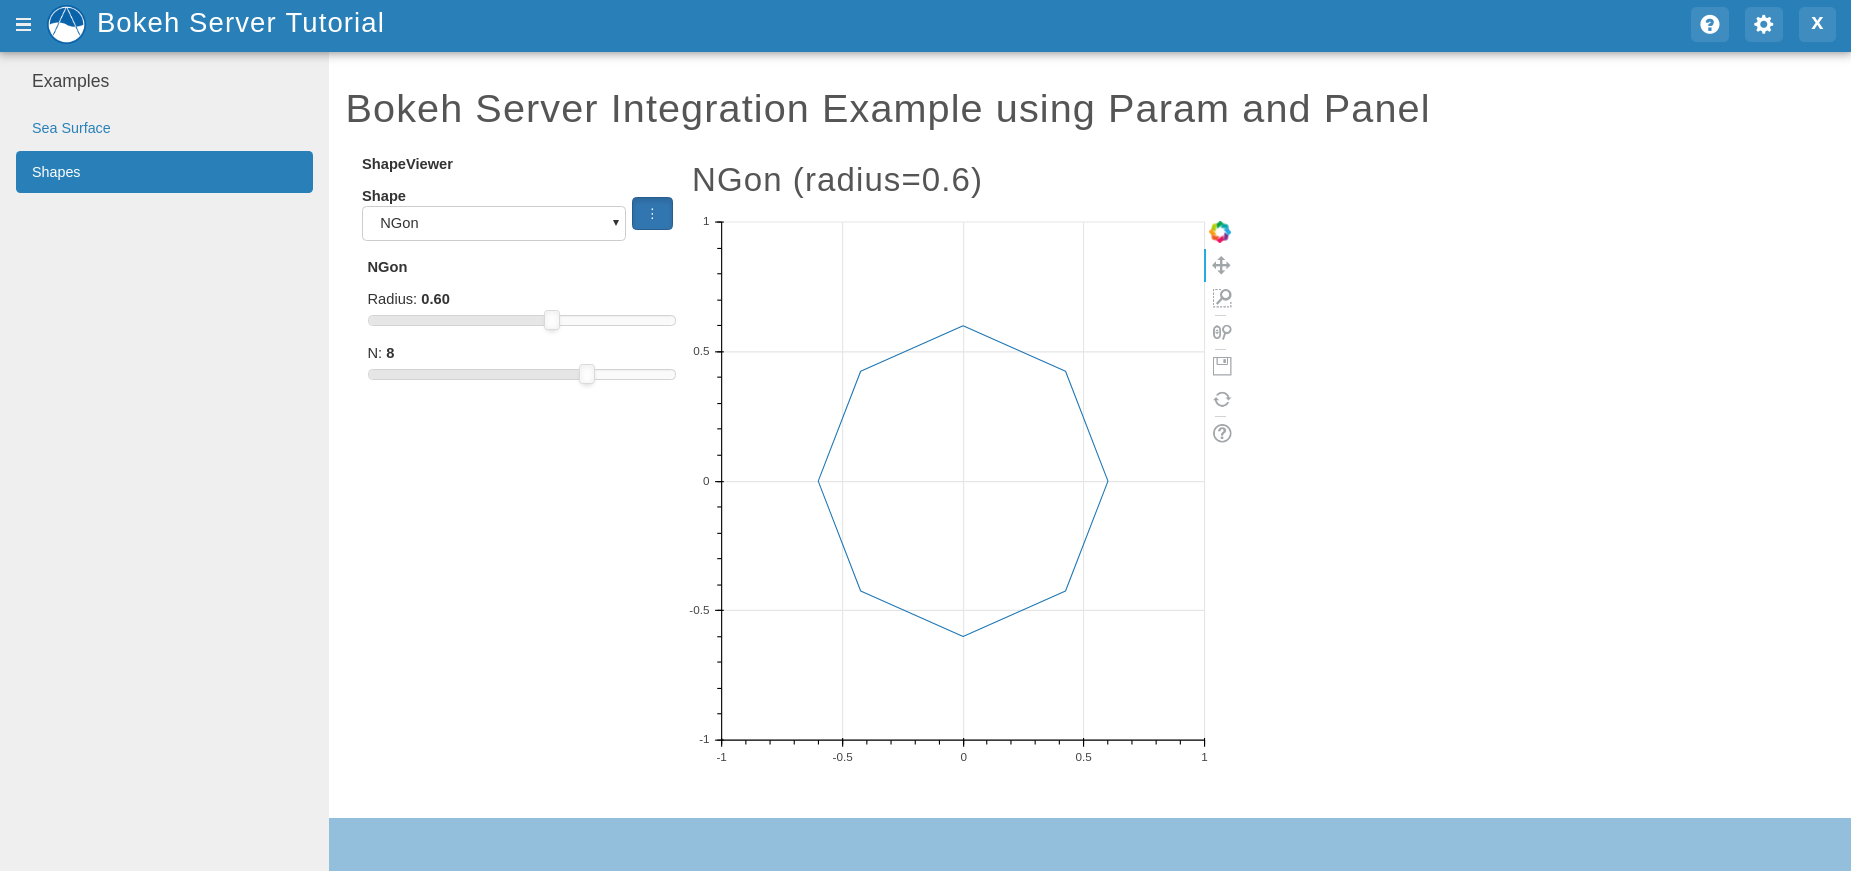
If you start tethys and go to the shapes endpoint of this app you should see something like this:
4. Solution
This concludes the Bokeh Integration tutorial. You can view the solution on GitHub at https://github.com/tethysplatform/tethysapp-bokeh_tutorial or clone it as follows:
git clone https://github.com/tethysplatform/tethysapp-bokeh_tutorial.git
cd tethysapp-bokeh_tutorial
git checkout -b solution solution-3.4